
CIO Viewpoint: The Recession Playbook

The Fed signalled confidence in the US economy by setting the plan of seven rate hikes in 2022.
Nonetheless, we see increased recession risks, mainly due to the Russia-Ukraine war and the Fed policy.
The surging inflation and oil prices, the war-induced supply shocks, and the stagflation risks remind us of the chaotic period during the 1970s. The Fed’s rate hike cycles almost always lead to troubles in the economy and capital markets. The nearly inverted US yield curve sends warning signals.
We try to address such recession risks and their implications on the market.
Surging oil prices suggest a 1970s replay?
The currently surging inflation and the almost doubled oil price from a year ago are not common in the US history. A pure data comparison suggests that they only happened during the 1970s (Exhibit 1).
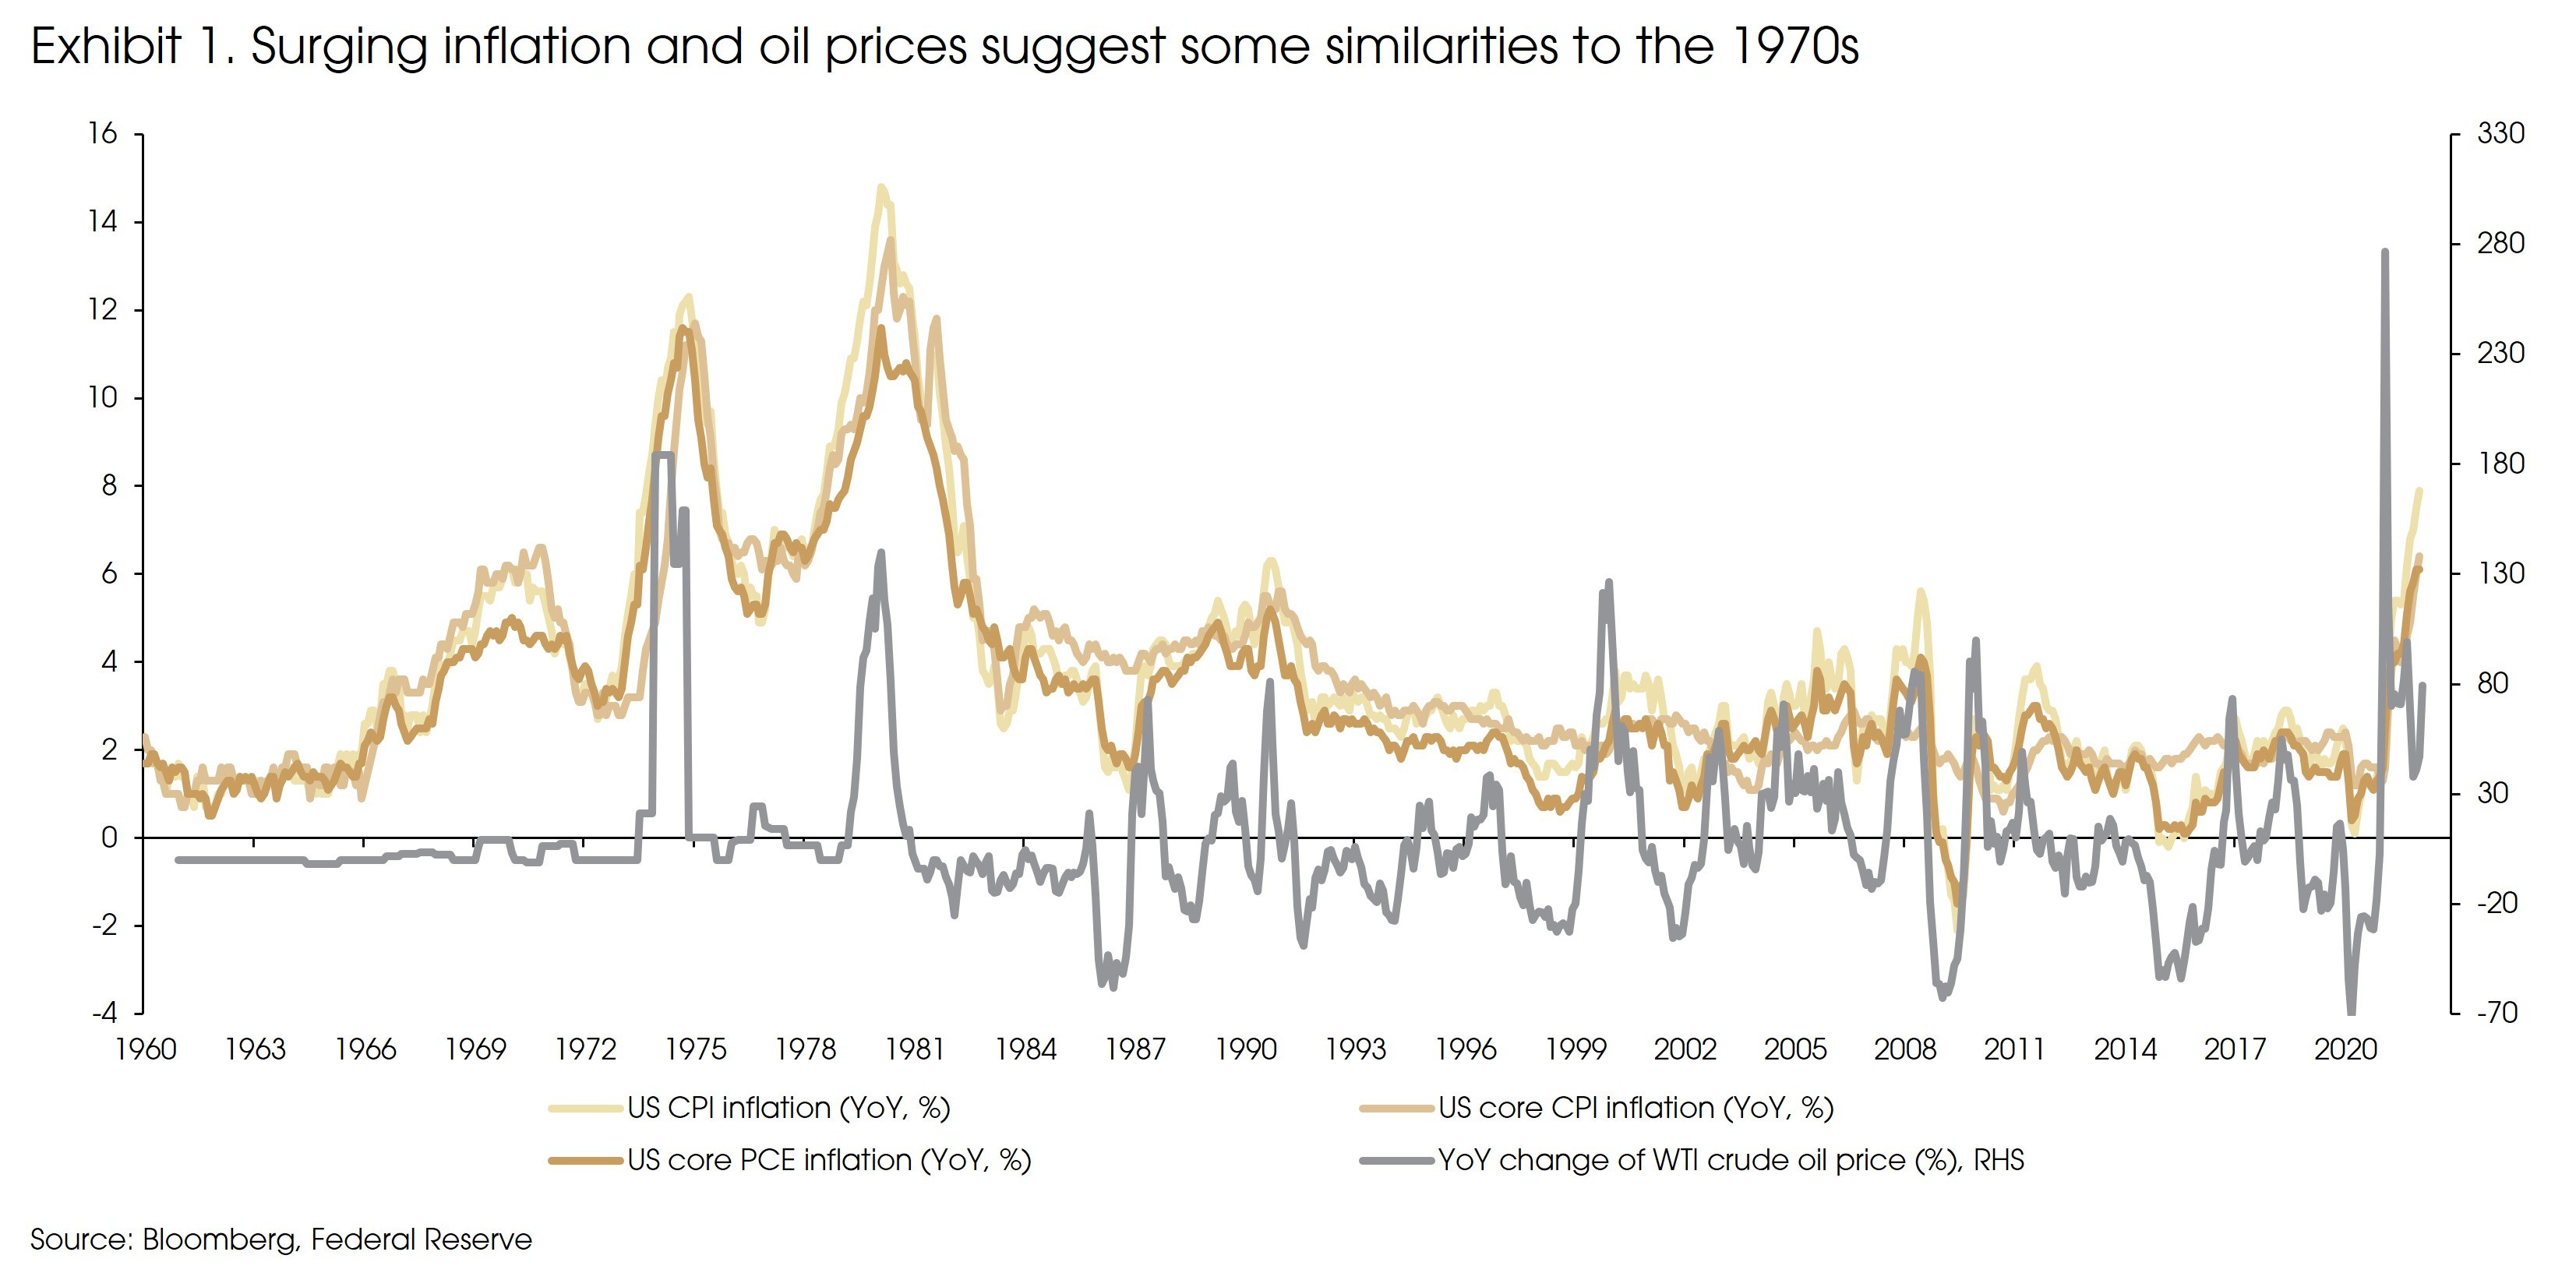
In addition, the Vietnam War in the late 1960s, the large fiscal stimulus under Nixon’s government, the oil embargo, and the food inflation all suggest similarities to today’s situation somehow.
It does not sound cheerful. The 1970s is a period with the most frequent recessions since 1949 (when the US GDP data started). Three recessions happened during the decade (1970, 1973, and late 1979).
Are we going to have a similarly troubled period now? We still do not think so.
Even though the Fed’s aggressive tightening plan further increased the similarity, we still see a number of differences.
First, the Vietnam War and the large fiscal stimulus under President Lyndon Johnson led to the rising inflation in the second half of 1960s. As a result, both the Fed and the US government tightened the policy in late 1960s. In addition, the US government also imposed price controls to curb inflation.
Such policy tightening led to a recession in 1970 with three quarters of negative GDP growth. To get re-elected, President Nixon wanted to boost the economy by announcing massive fiscal stimulus before price controls were lifted. Such an idea was also supported by the then-Fed Chairman Authur Burns.
However, when price control ends in 1973-1974, inflation surged.
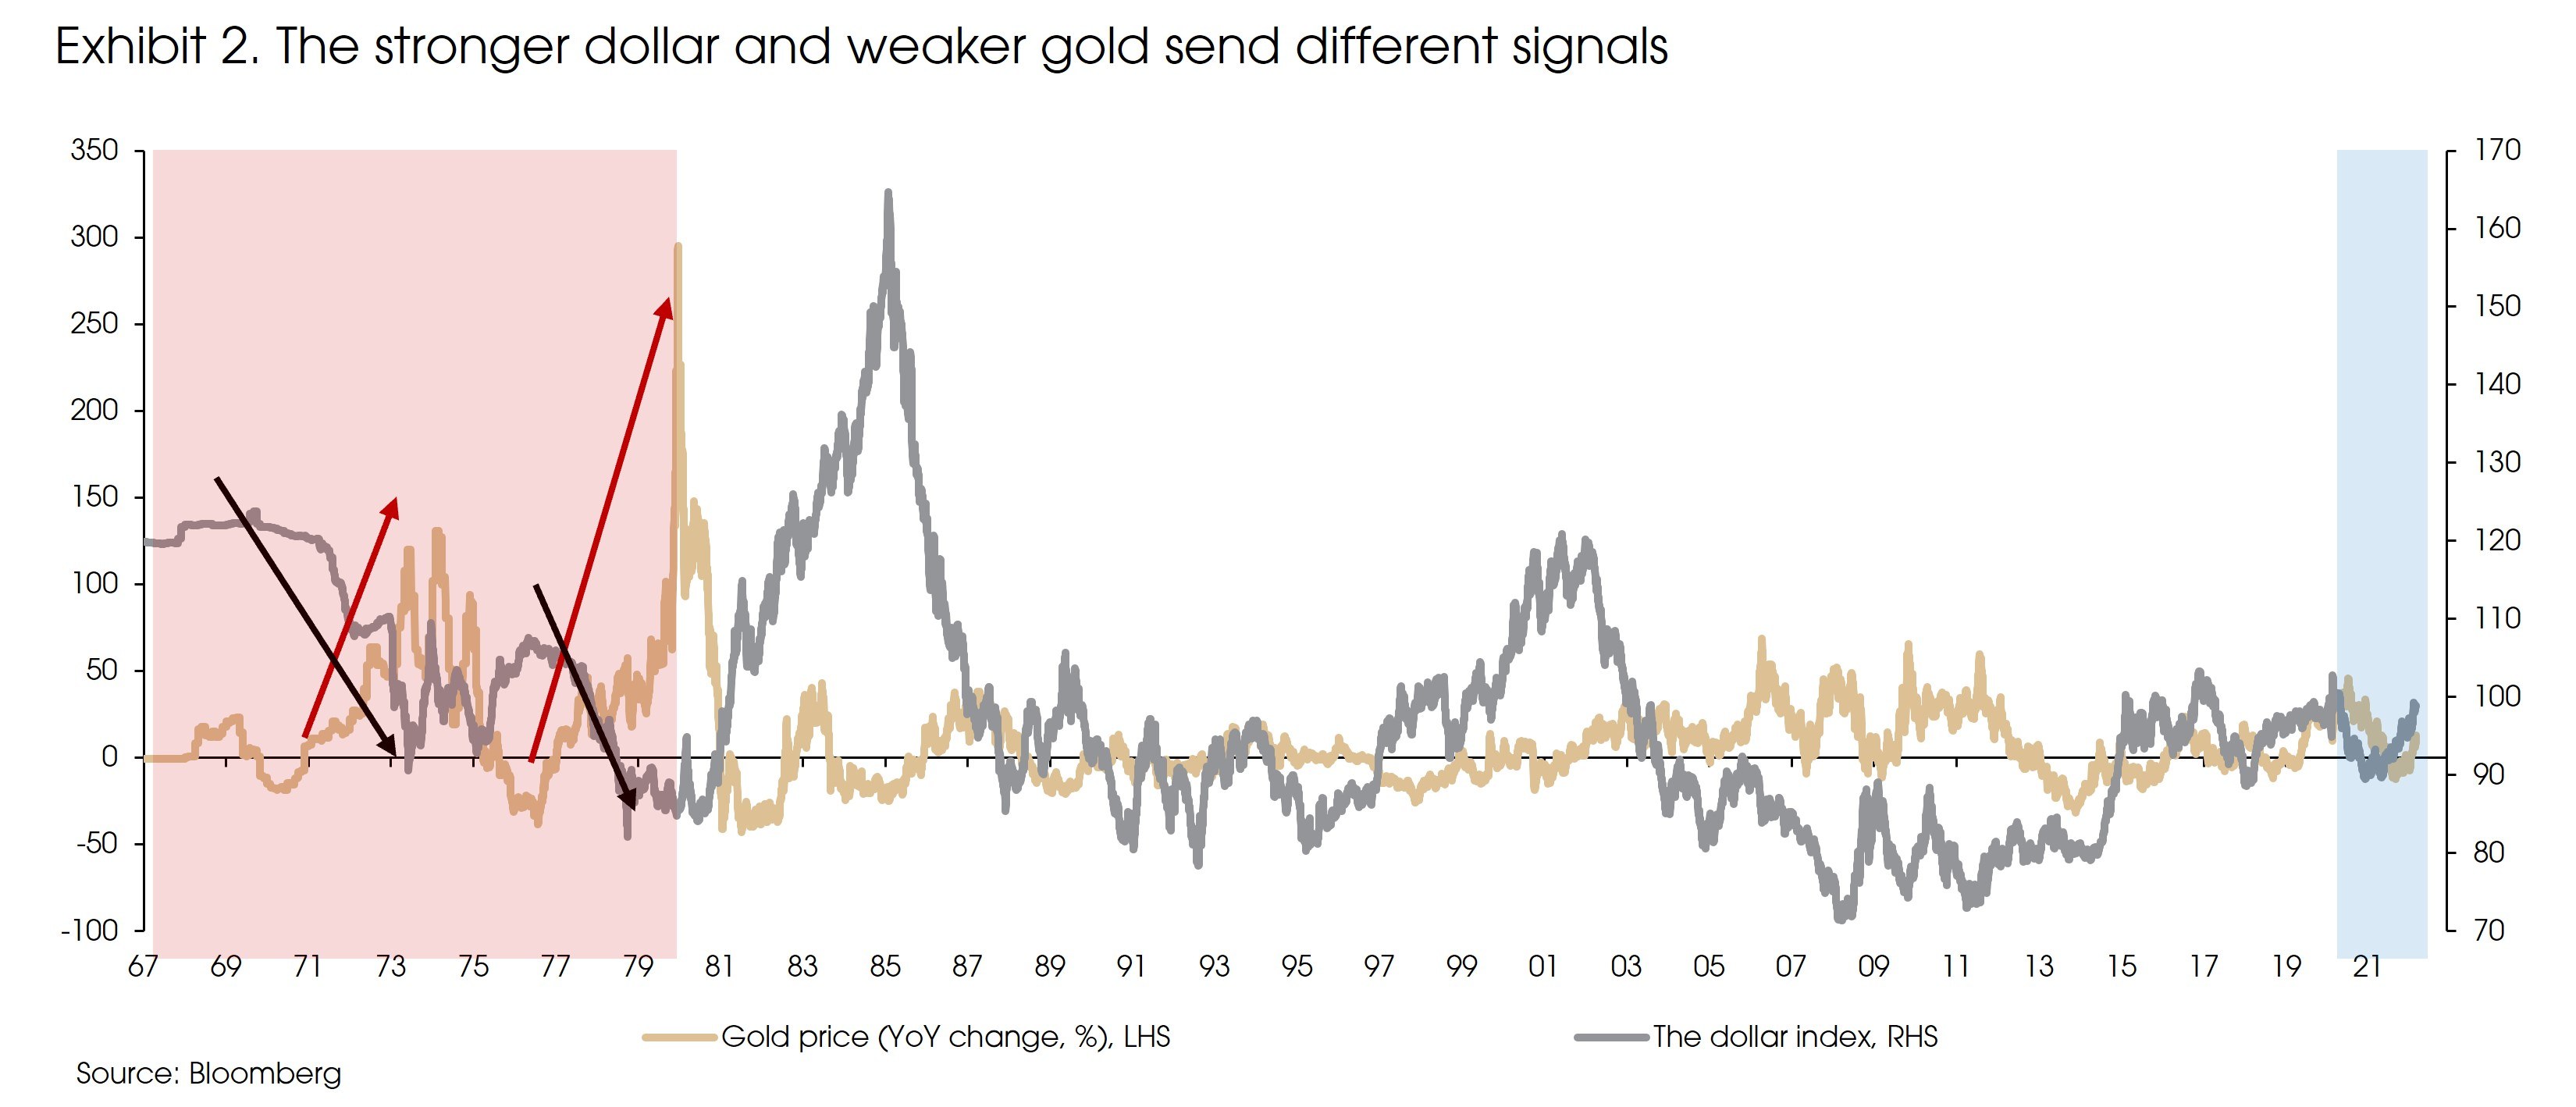
Second, the breakdown of the Bretton Woods System led to a decade fall of the dollar, contribution to inflation pressures. The dollar dropped more than 30% during the decade.
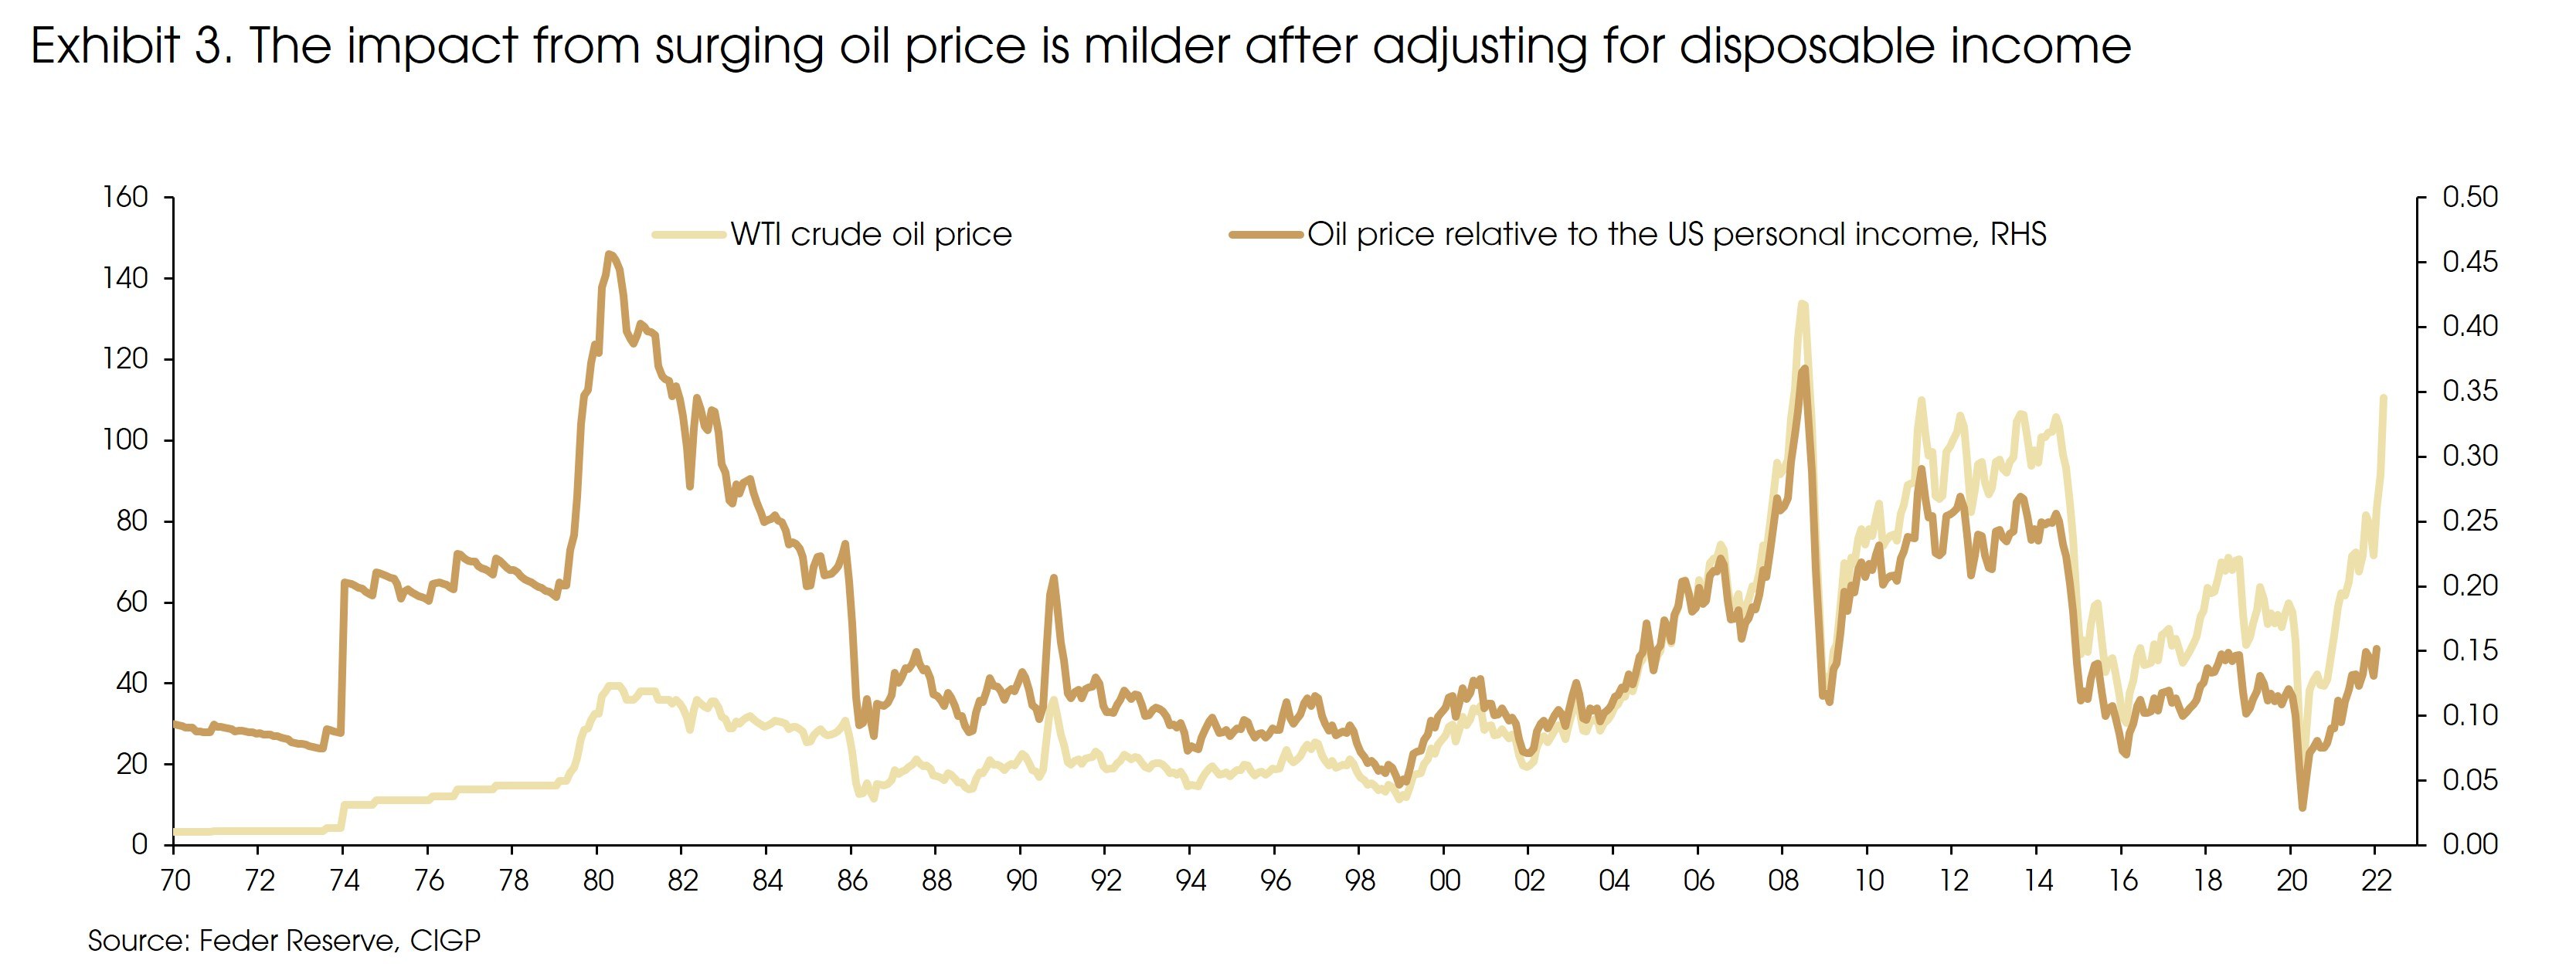
In addition, the oil embargo had a much a larger impact on the US economy in 1970s than if a similar situation happens today. The imported oil from OPEC countries accounted for more than 30% of the US oil consumption, compared with only 4.5% now.
Finally, the US government adopted fiscal tightening to control inflation in late 1970s. Now we all know that fiscal tightening reduces price pressures by cracking down total demand and economic growth first.
Without going into further details of the macro backdrop, Exhibit 2 and Exhibit 3 suggest meaningful differences between the current period and the 1970s.
The bottom line here is: for the 1970s’ price control, Bretton Woods System breakdown, and the oil embargo, none is the case today. Inflation should be much less sticky, which was already peaking before Russia invaded Ukraine. Without further escalations of the war, price pressure should moderate in the coming months: energy prices have already started falling, and global supply chains will further normalize as countries continue to re-open, reducing pressures on inflation and growth.
Alarming signals: the almost inverted yield curve
We believe that we are in a much better situation than the 1970s. That said, it does not suggest “no recession/ market downturn” risks. As the Fed started the rate hike, one thing to notice is that in practice, the rate hikes have seldom delivered a “soft landing” (no economic recession) in history.
Based on the data since 1962, there have been 11 rate hike cycles, and 8 of them were followed by recessions (Exhibit 4).
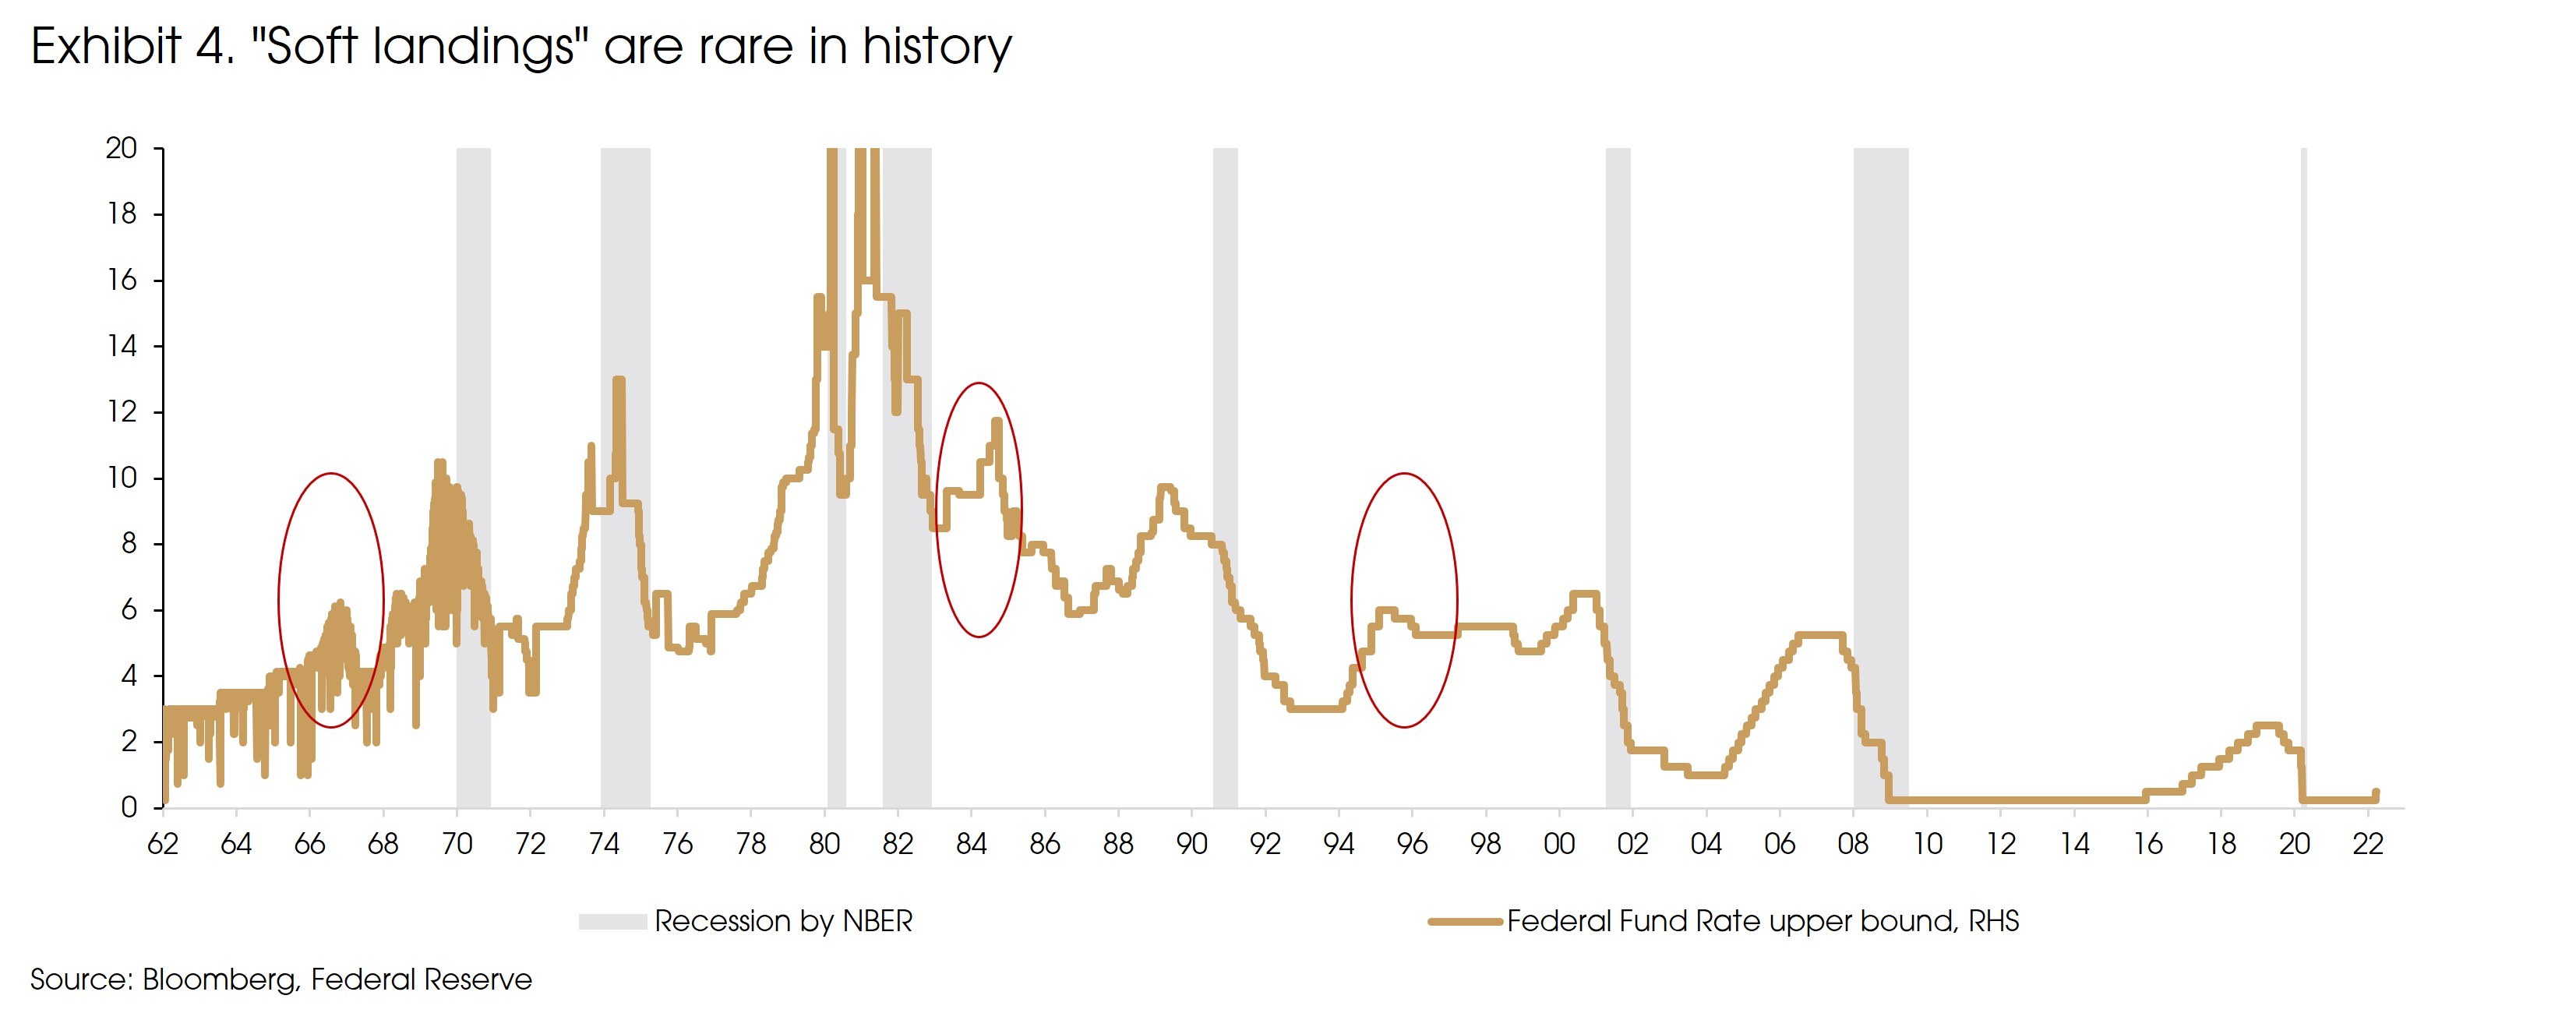
Of course, we can blame the COVID outbreak in 2020, the over-leveraged housing market in 2008, the “Internet Bubble” in 2000, the Iraq War in 1990, the too-tight fiscal policy in early 1980s, the OPEC in the 1970s for causing recessions. However, the only consistent driver behind each of the eight recessions during the past 60 years is the rising policy rate from the Fed.
There are exceptions. In 1965, 1984 and 1994, the Fed raised interest rates enough to cool the economy and inflation pressures while did not lead to negative GDP growths or big downturns in the capital market.
It could happen again today, according to Chairman Powell. However, we see worrying signs.
Instead of using the level of inflation/unemployment/real interest rate combination to gauge the probability of a “soft landing” (e.g., lower inflation and higher unemployment rate are considered as favorable conditions for the Fed to deliver a soft landing), we look at a more direct indicator, the yield curve.
An inverted yield curve is typically a sign that policy has turned too restrictive for the underlying economy. The long-term track record of the yield curve in forecasting recessions suggests that it is accurate (Exhibit 5).
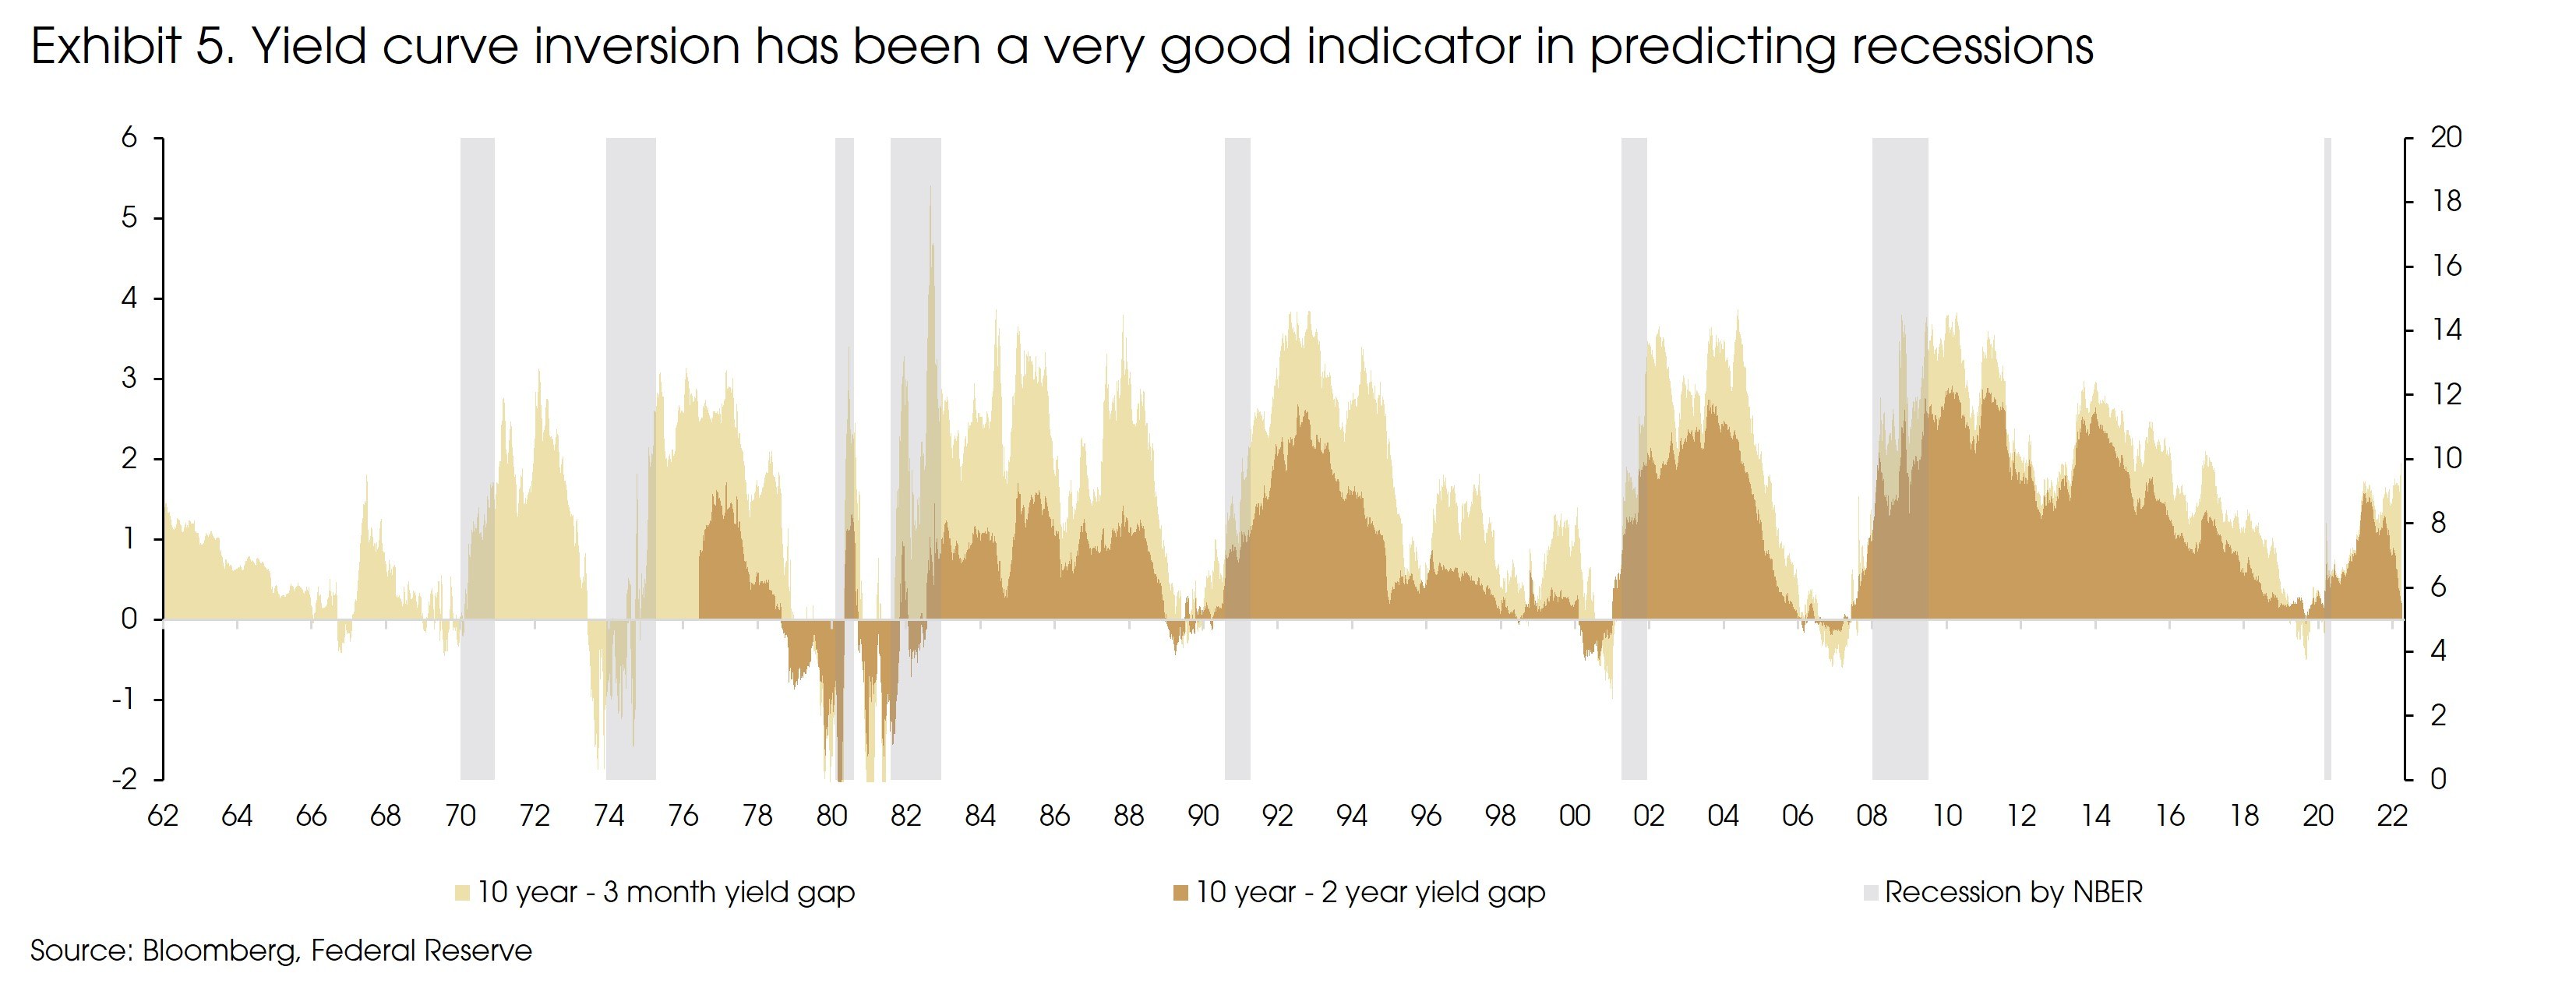
The yield curve inverted (the 10-year minus 2-year yield gap or the 10-year minus 3-month yield gap turning negative) ahead of every recession since 1962. There was only one and a half false signal(s), in 1965 and in 1998.
The 1965 inversion did not lead to a recession, probably due to the large fiscal stimulus under Johnson’s government. Still, economic growth fell significantly.
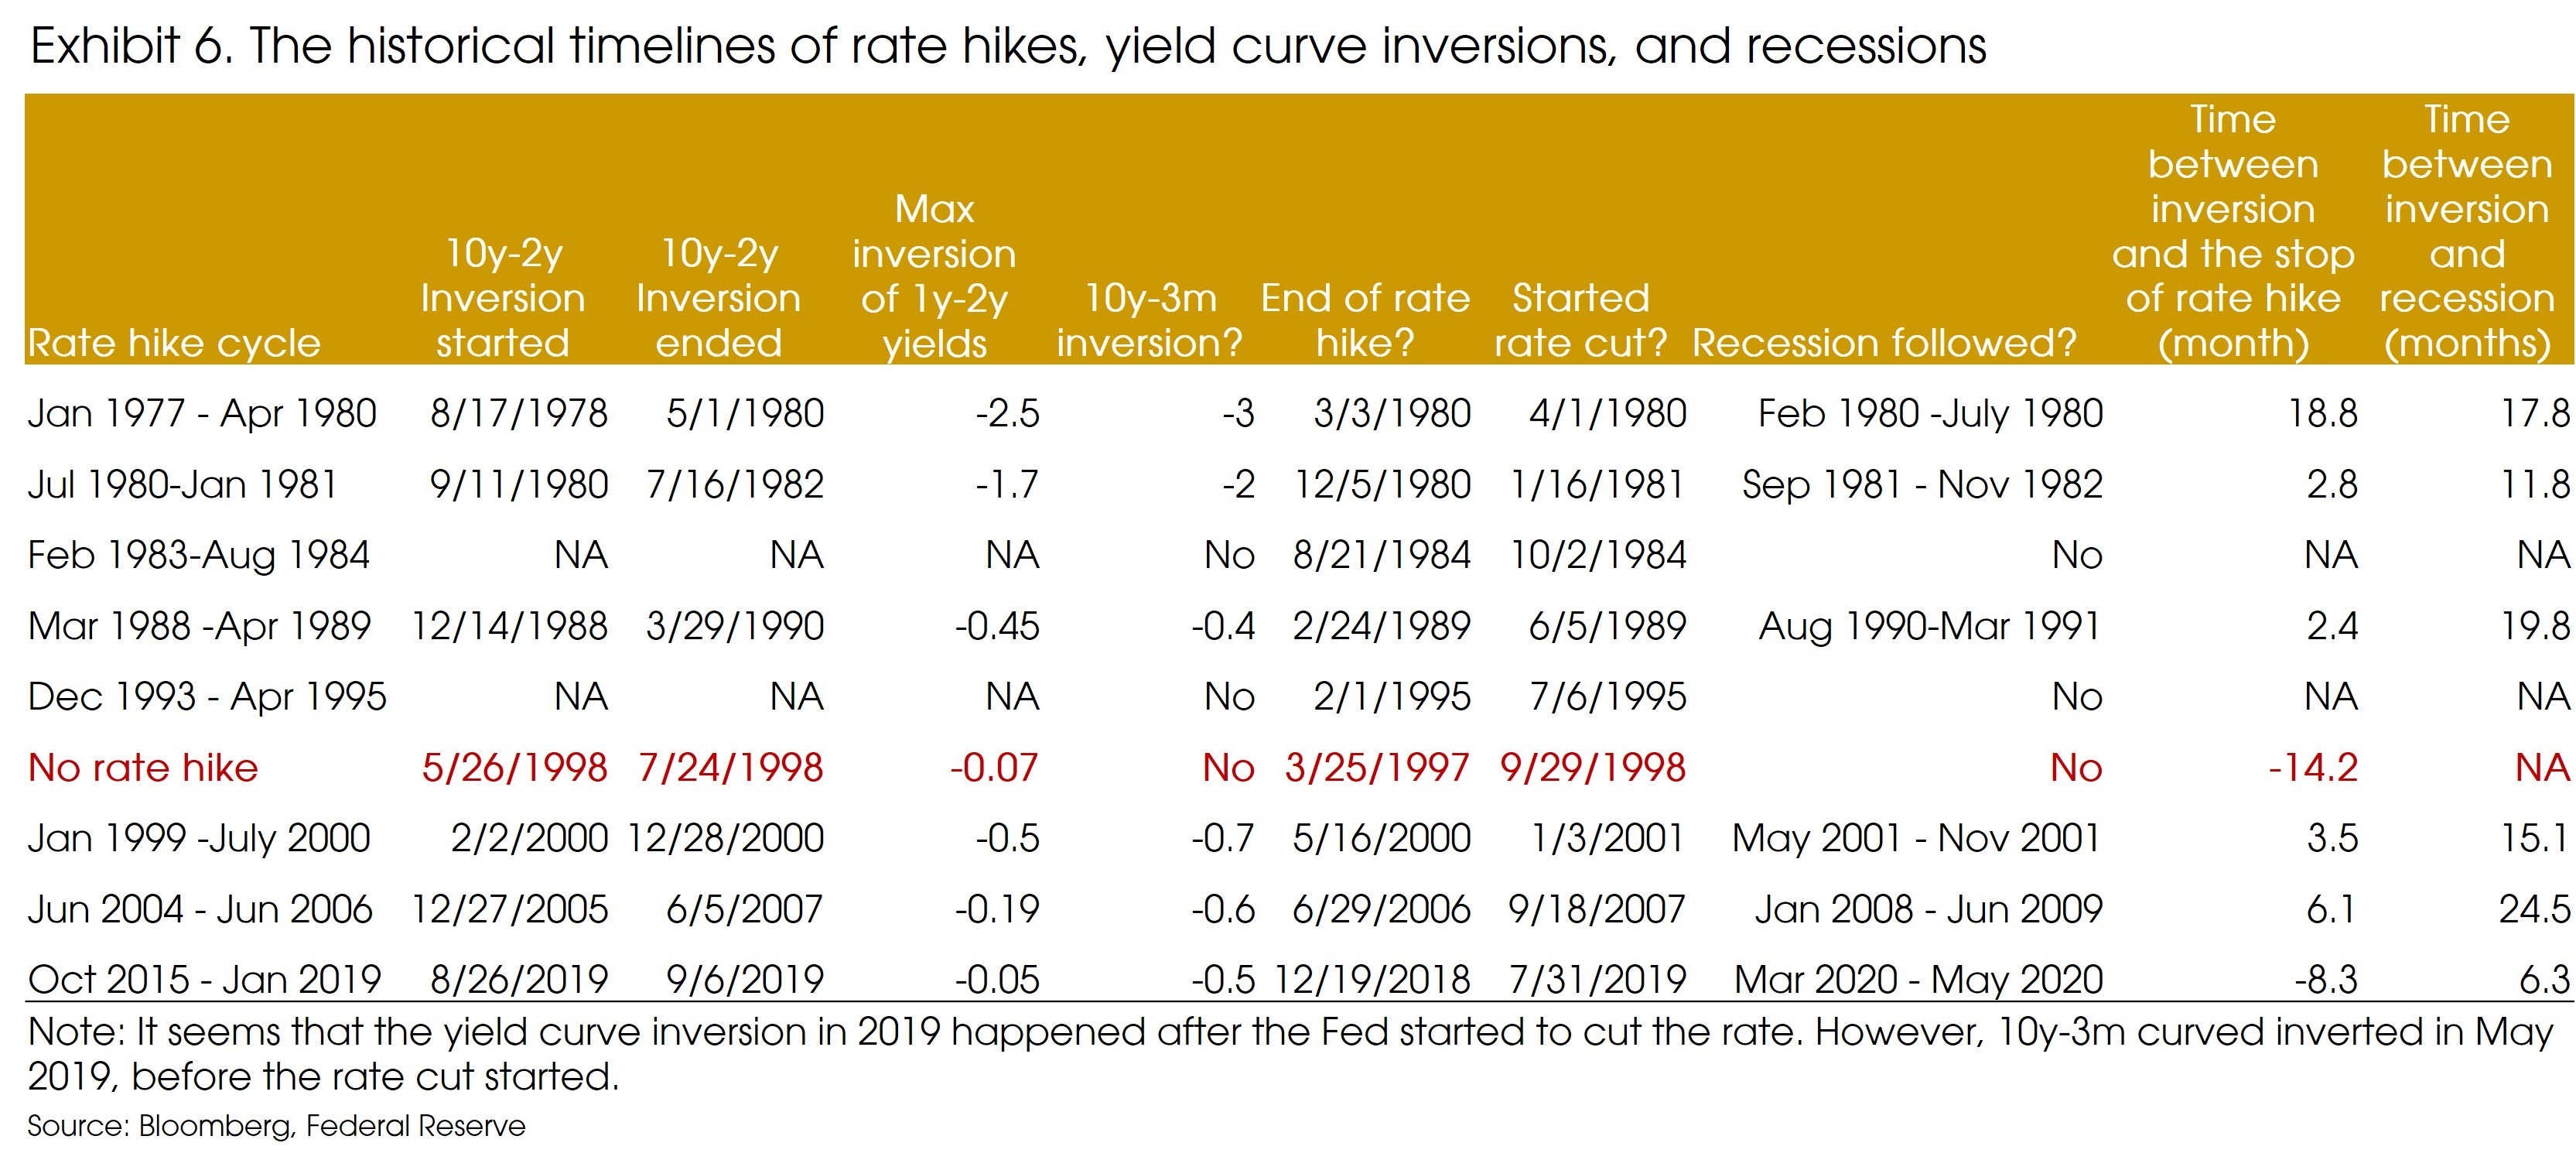
Compared with the 1965 inversion, the 1998 yield curve inversion was not typical. All the yield curve inversions started during rate hike cycles, except the 1998 one. The Fed already ended the tightening cycle in March 1997 (Exhibit 6). The yield curve inversion was very mild and short-lived: The 10y-2y gap was only down to -0.07%, and the 10y-3m gap remained positive. The 1998 inversion was not driven by the domestic economic/policy conditions in the US, but external shocks (i.e., the 1998 Asian Financial Crisis). Therefore, we see the 1998 case as a half false signal.
In that sense, some may say that the 2019 yield curve inversion also did not happen during rate hike cycle, as the Fed started to cut the rate in July while the inversion happened in August. It is the case for the 10y-2y inversion, but the10y-3m inversion happened earlier in May, which led to the shift of the Fed’s policy.
In addition, Exhibit 6 shows a clear pattern that during rate hike cycles, if yield curve inverts, no matter the 10y-2y or the 10y-3m curve, the Fed will turn dovish, i.e., stop hiking the rates or start rate cuts. Nevertheless, a dovish turn upon the already inverted yield curve will not prevent a recession, which happened between 6 month -2 years after the inversion.
Overall, there is a strong correlation between yield curve inversion and recession. To achieve another “Soft landing” the Fed may need to avoid another yield curve inversion.
Currently, the intraday 10y-2y gap has already inverted once. Even though we can ignore this flash inversion, the below-5-basis-points gap is not a good signal.
That said, we do not completely disagree with Chairman Powell. There are factors that may help avoid a meaningful inversion. If the war ends soon, the near-term inflation pressures will moderate, and growth outlook will improve, both leading to steepening yield curves. Besides, the market has priced in a 2.5% increase of the policy rate at the end of 2021. As long as the Fed does not become more hawkish, the upside for the shorter-term 2-year yield should be limited.
The bottom line here is that the currently near inverted yield curve is sending worrying signs of a looming recession, despite the Fed’s hope of a “soft landing”.
Yield curve inversion suggests increased volatility and growing risk-off sentiment
There is no perfect “playbook” for investments, especially under the current market condition with significant uncertainties. Still, we can find some “reference” from the historical patterns.
As we are already in a rate hike cycle from the Fed, if the US yield curve inverts, we need to get prepared for a possible recession.
That said, there is considerable time between yield curve inversion and recession, at least 6 months, seen from the history (Exhibit 6). There is no need to panic.
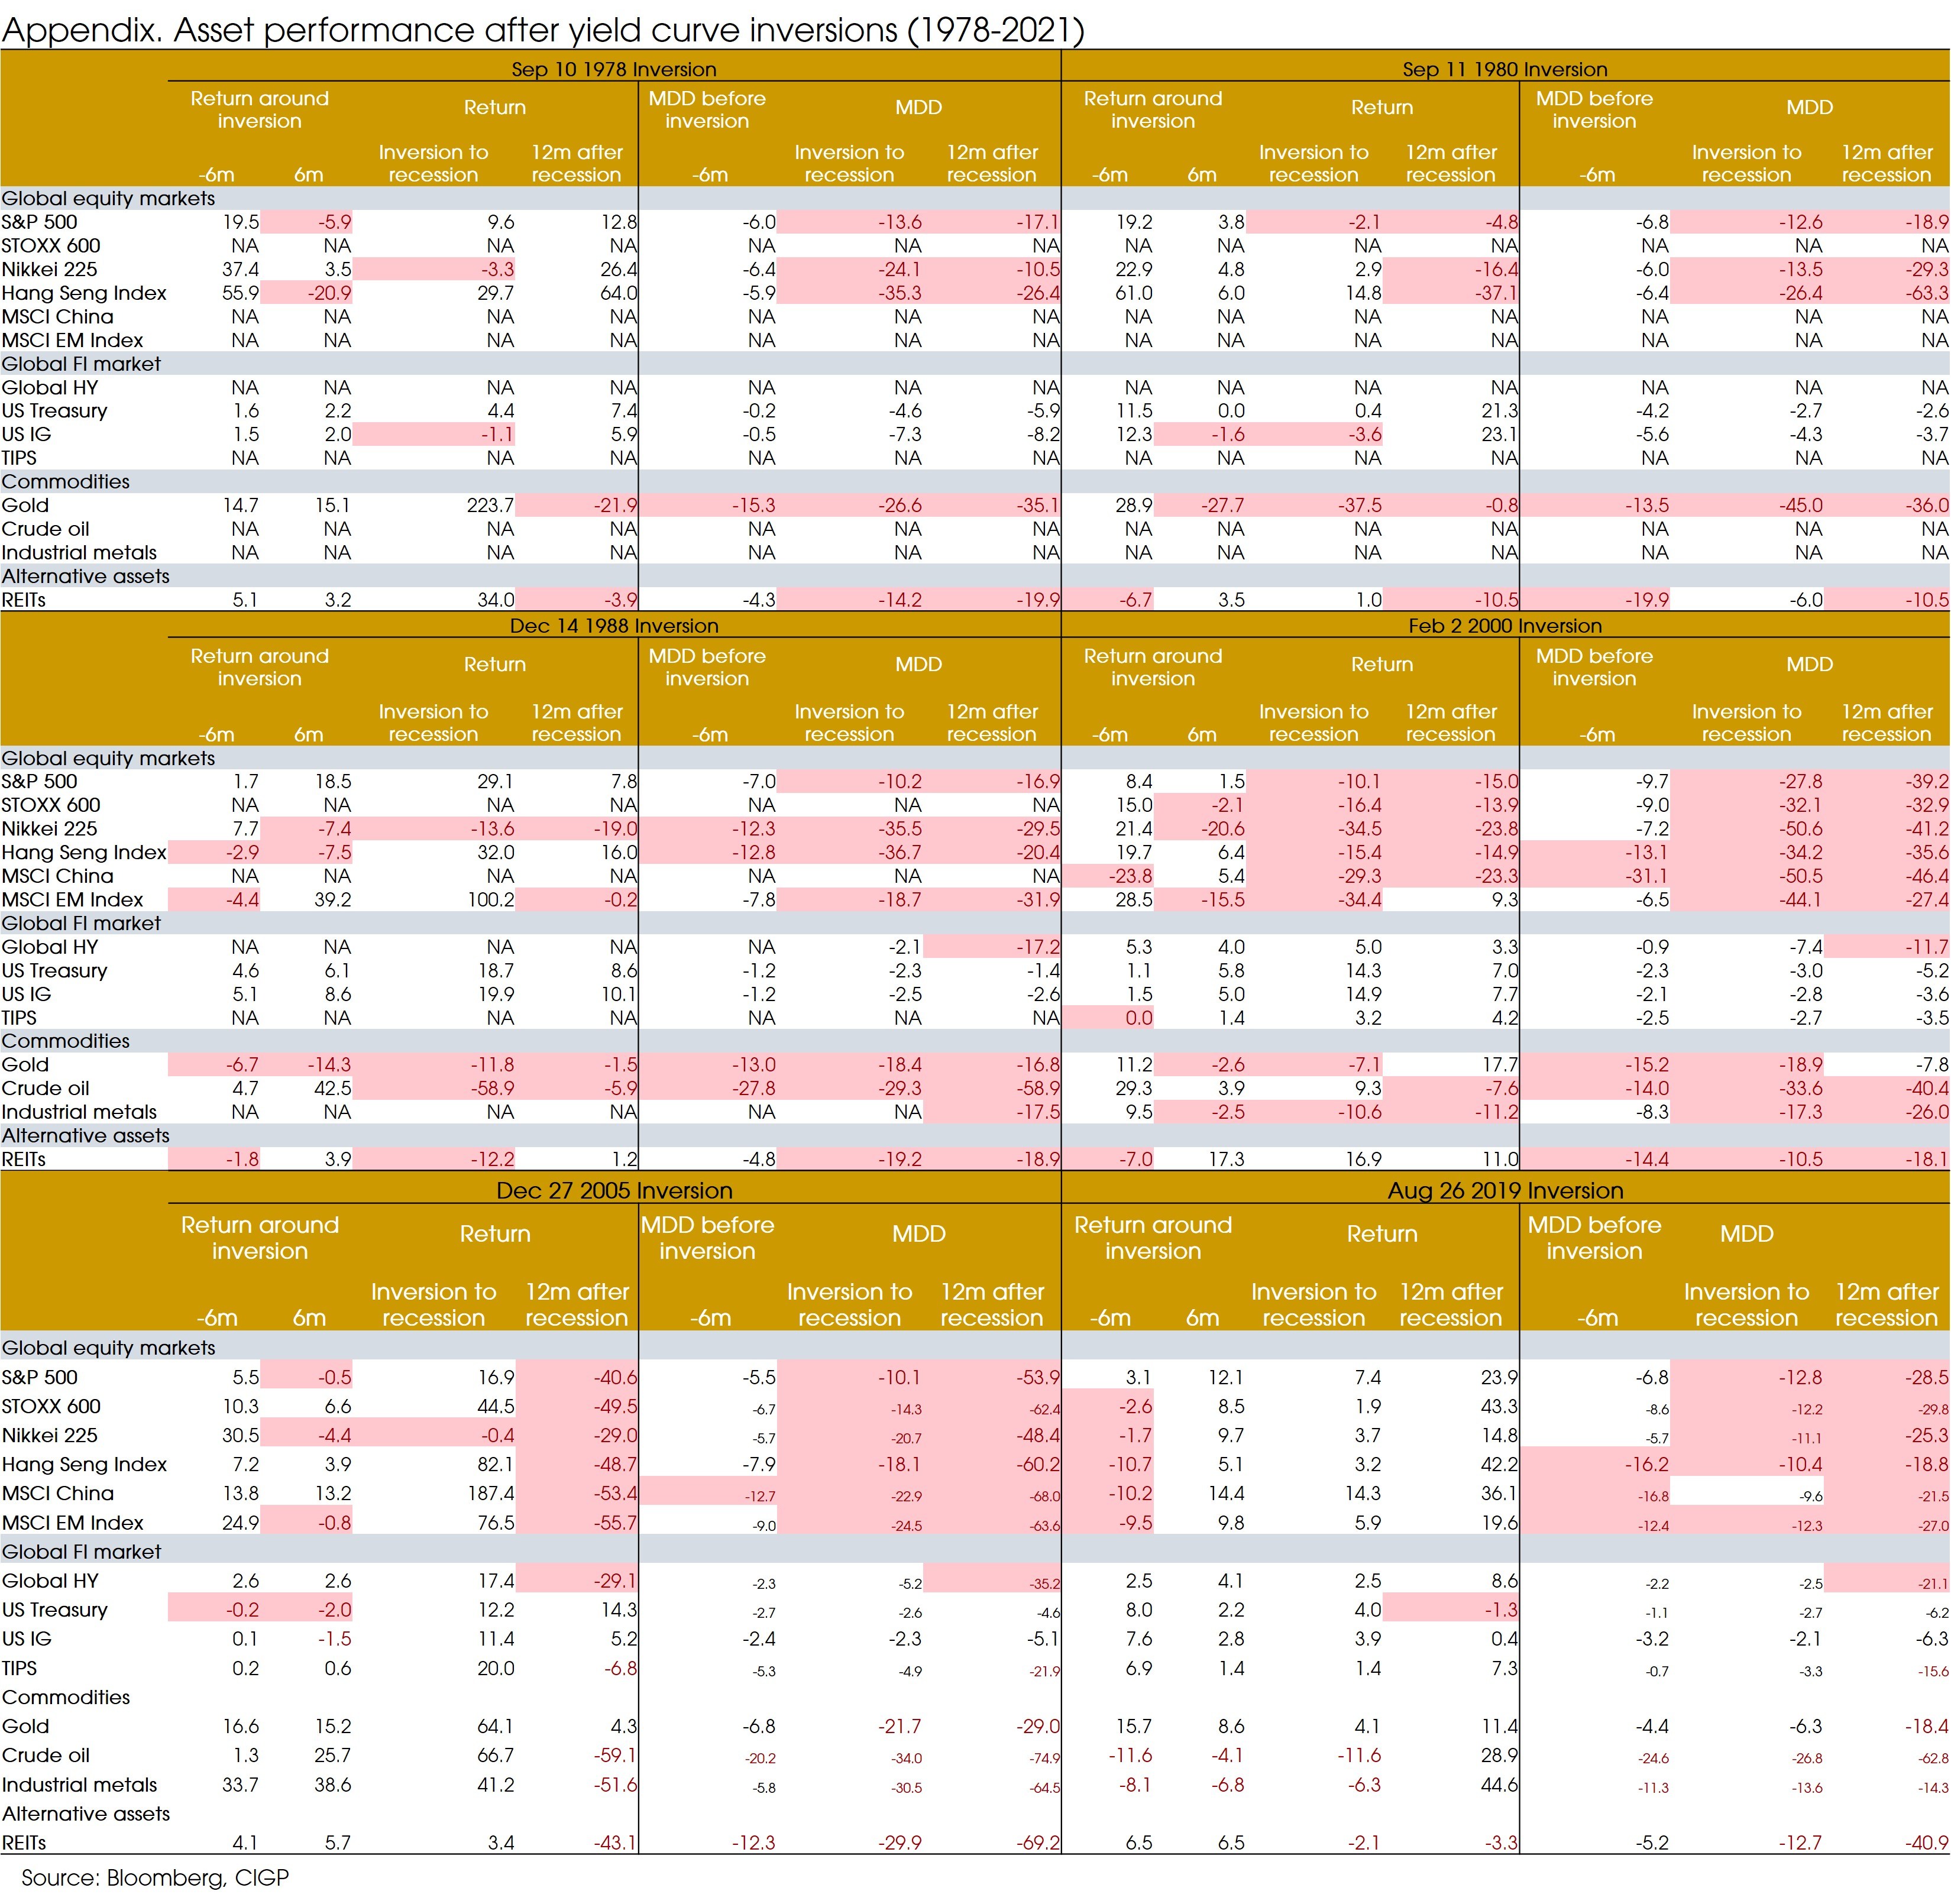
We calculate asset returns and maximum drawdowns during the 6 months before the inversion of the yield curve, 6 months after the inversion, returns between inversion and recession, and 12 months after the recession starts.
Exhibit 7 shows the median performance during the six “yield curve inversion – recession” periods since 1978 (we excluded the 1998 episode).
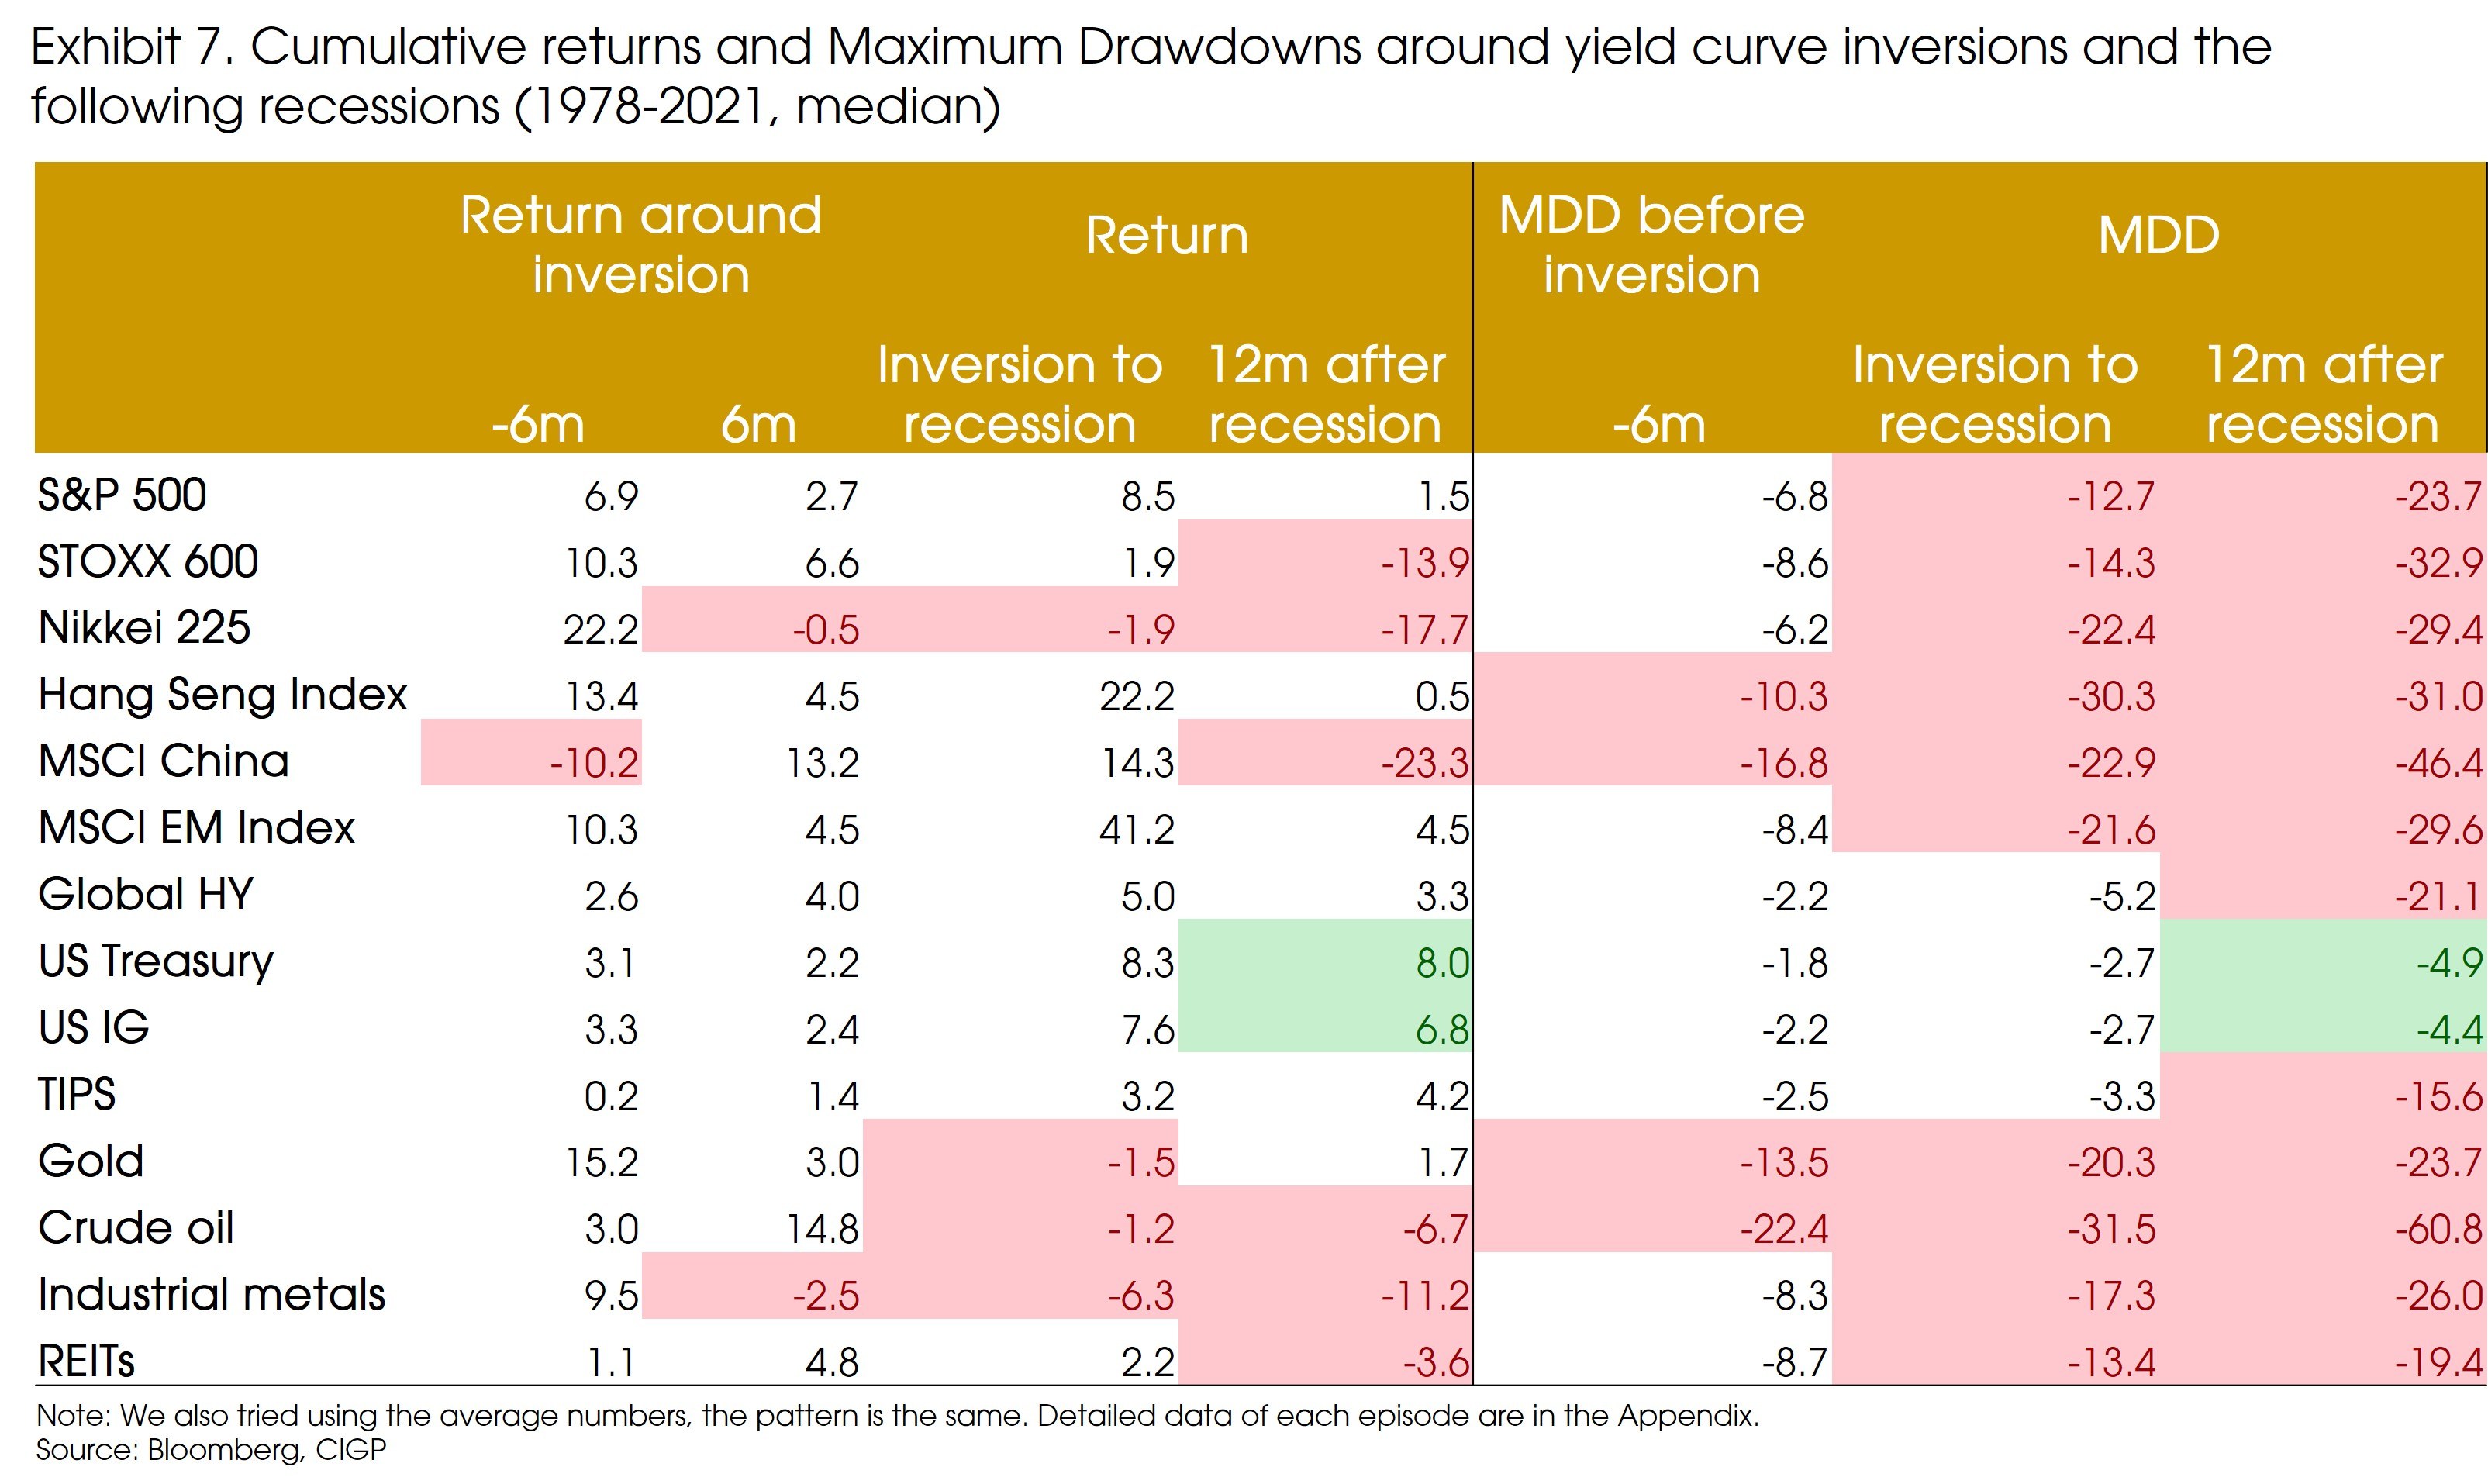
There are several patterns. For most of the episodes:
1. Developed markets’ (the US, EU, and Japan) equity returns weakened after yield curve inversion, markets volatility increased (suggested by deeper drawdowns).
2. Volatility of emerging markets’ equity will also increase. However, it is not significant that the equity returns will be lower.
3. From yield curve inversion until the start of the recession, equity performance remained positive for most of the cases. The reason could be that the Fed usually stops hiking the rate in 2-3 months if the 10-2 yield gap turns negative, supporting equity performance.
4. There is no significant pattern for bond markets around yield curve inversion. However, they are the winners during recessions, significantly outperforming other assets (for example, the safe assets, i.e., Treasuries and investment grade bonds). The downside is also much more limited than equities or commodities.
5. Meanwhile, equities further tumbled during the recession periods. The volatility of equities and commodities significantly increased after recession started. In general, maximum drawdowns during the following first 12 months within recessions were deeper than 20%.
6. Commodities’ performances are similar to equities. However, it is a bit surprising that gold, as a safe-haven asset, did not show significant downside protections during recessions.
The potential yield curve inversion is a key indicator to watch. If it happens, we do not expect to see immediate selloffs in the market, as there will be a considerable time window (at least six months seen from the history) before markets fall. During this period risk assets will continue to pose positive returns.
We should take this window to turn further defensive, by raising cash or increasing safe-assets, for example government bonds and investment grade bonds.
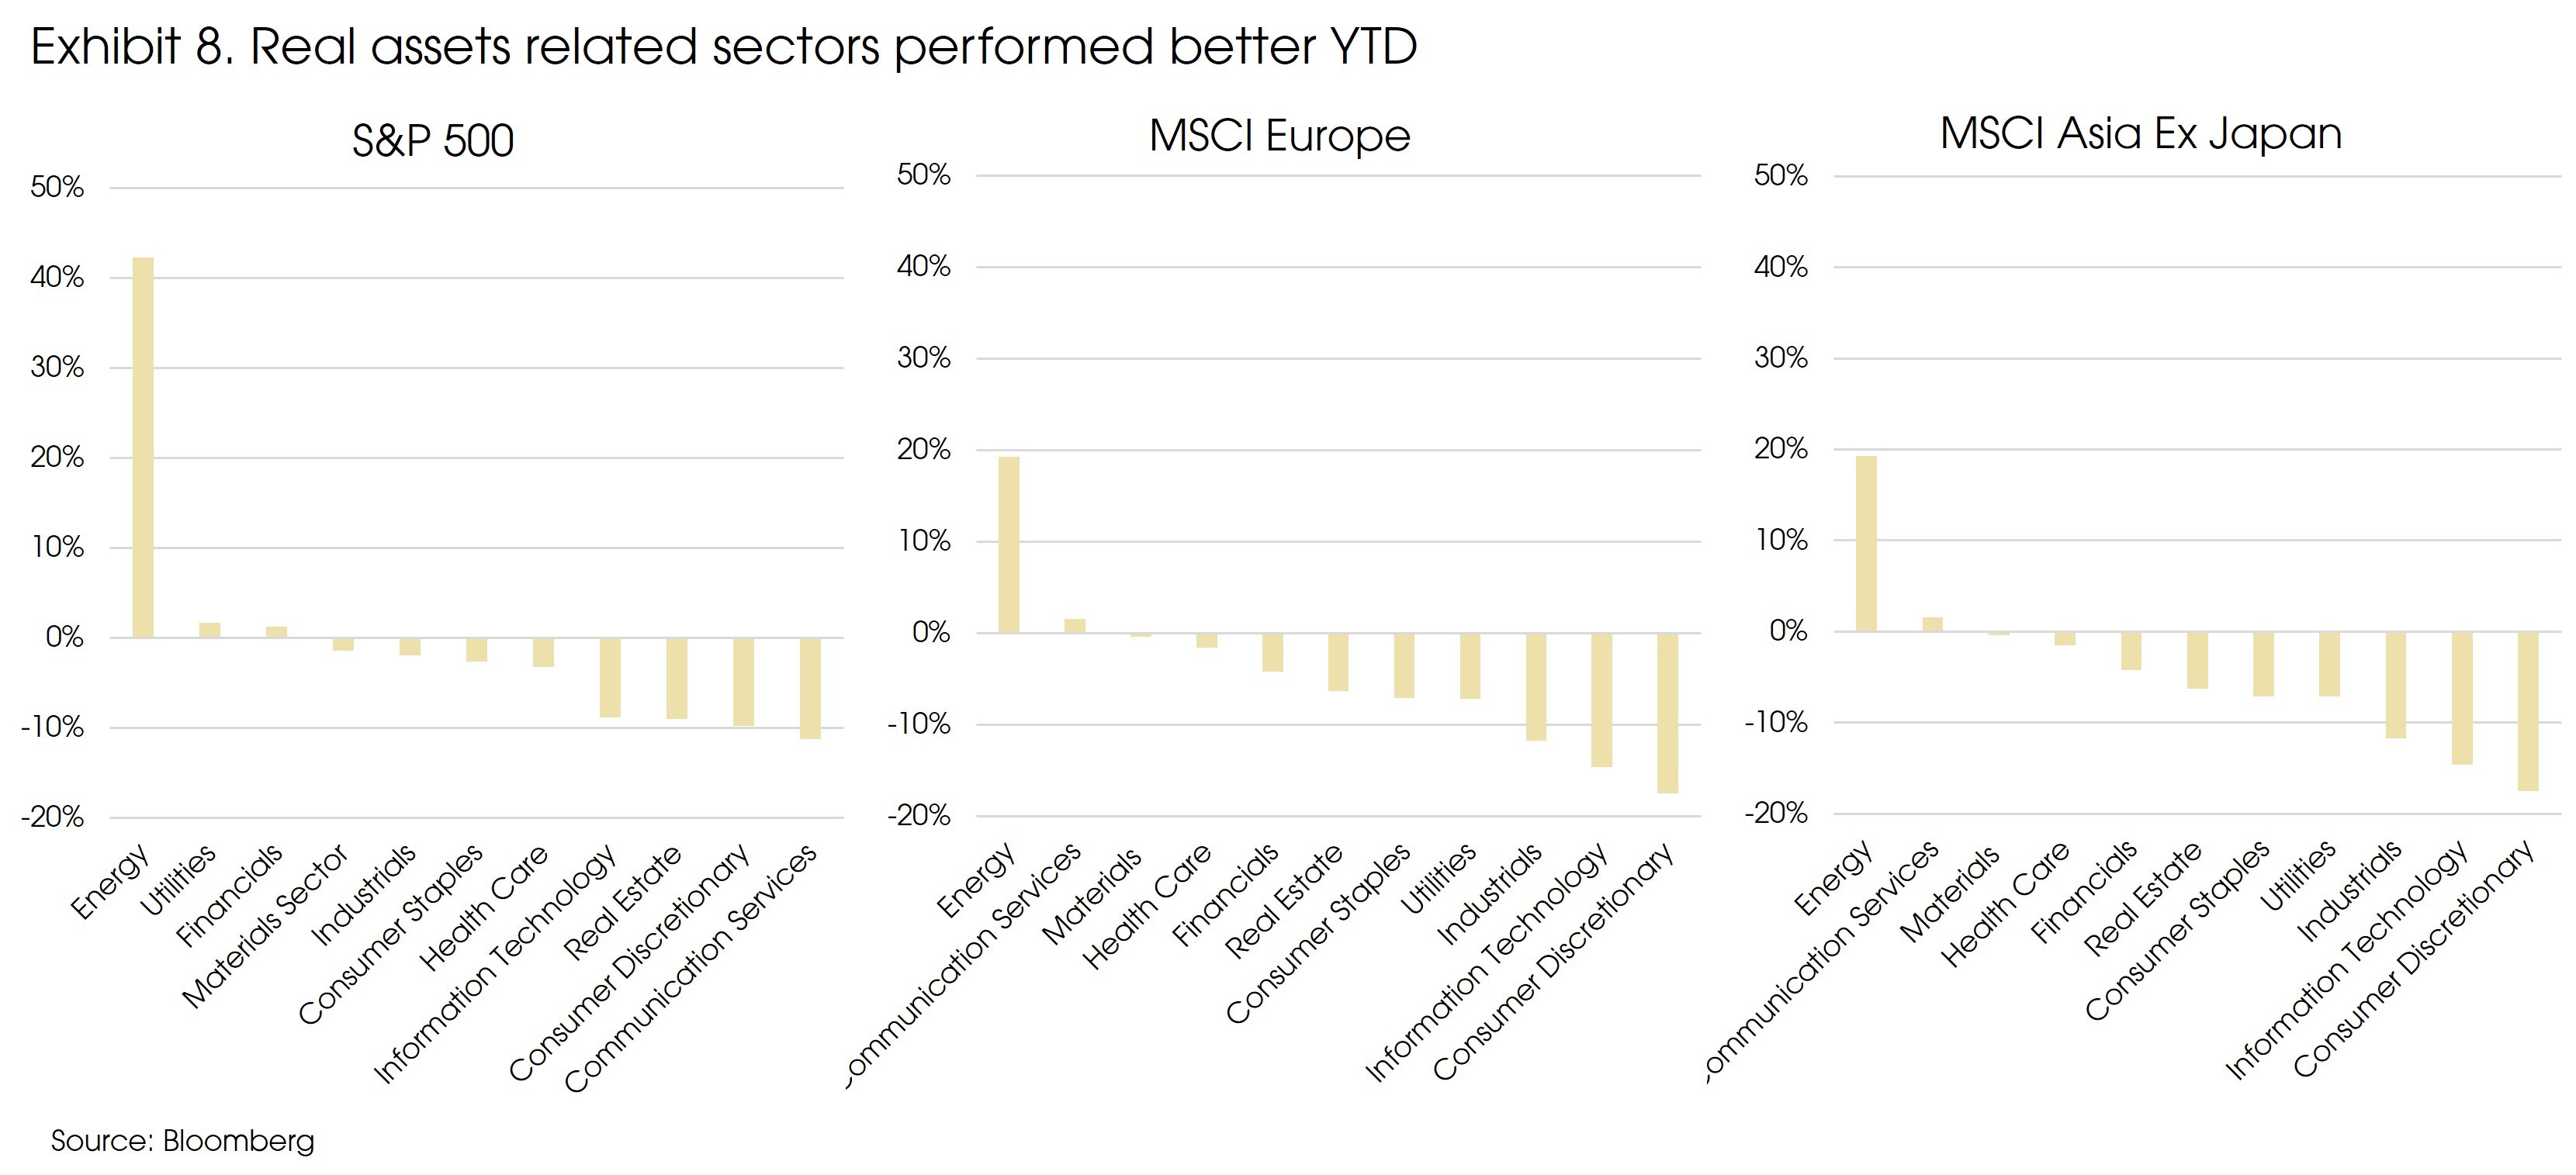
Beyond the recession playbook, we will continue to focus on the sectors with long-term investment opportunities.
Higher inflation led to investors’ preference towards real assets. Real assets related sectors, such as Energy, Materials, and Real Estate performed better YTD (Exhibit 8). These sectors may continue to enjoy the tailwind in the near term, as inflation will remain elevated even with a moderated momentum. If the monthly price change decreased from the current 0.5% to 0.1%, headline CPI will stay at 6% at year end.
However, we do not see inflation will remain at 5-6% for long. Supply disruptions will fade eventually, leading to a fall in inflation. The market prediction suggests that longer term inflation remained anchored at 2.5% (much milder than the shorter-term inflation expectation of 5%).
The post-pandemic period may see some changes compared with the post-2008 period. Government will be less hesitated in increasing spending to support economic growth. Moreover, the green transition can be a driver for increased capital spending in the coming decade.
Specifically, this trend should be more pronounced in Europe: 1) the fiscal austerity mindset in some major European countries finally changed during the pandemic period. 2) EU governments are among the most aggressive ones in achieving carbon neutrality, and the war will further accelerate the trend from energy independence/security side.
Even if the long-term trends of declining population growth and technology innovation are both deflationary, larger government spending may still slightly push up inflation and interest rates, especially compared with the “weakest recovery cycle” after 2008. This should narrow the gap between Growth vs. Value, but this does not mean that Value will outperform Growth.
It is hard to imagine that the Value sectors such as energy, materials, real estate will lead the future global growth. As long-term investors, we remain convinced that the most interesting investment opportunities will emerge from the mega trends. These trends are irrefutable despite different economic/policy cycles, such as disruptive technology, digitalization, Biotech, green energy, and the EM consumer market.
Sources: Bloomberg, Federal Reserve, CIGP


