
CIO 2024 Outlook: The Start of an Easing Cycle
Author: Yao Wang and Jess Cheung Editor: Nicolas Sioné

1. A better than feared 2023, but a slower 2024
The global economy fared better than expected in 2023, driven by the developed world (Exhibit 1). GDP growth in the US, Eurozone, and Japan outperformed market forecasts made earlier last year. Meanwhile, emerging market (EM) economies, especially emerging Asia, generally underperformed.
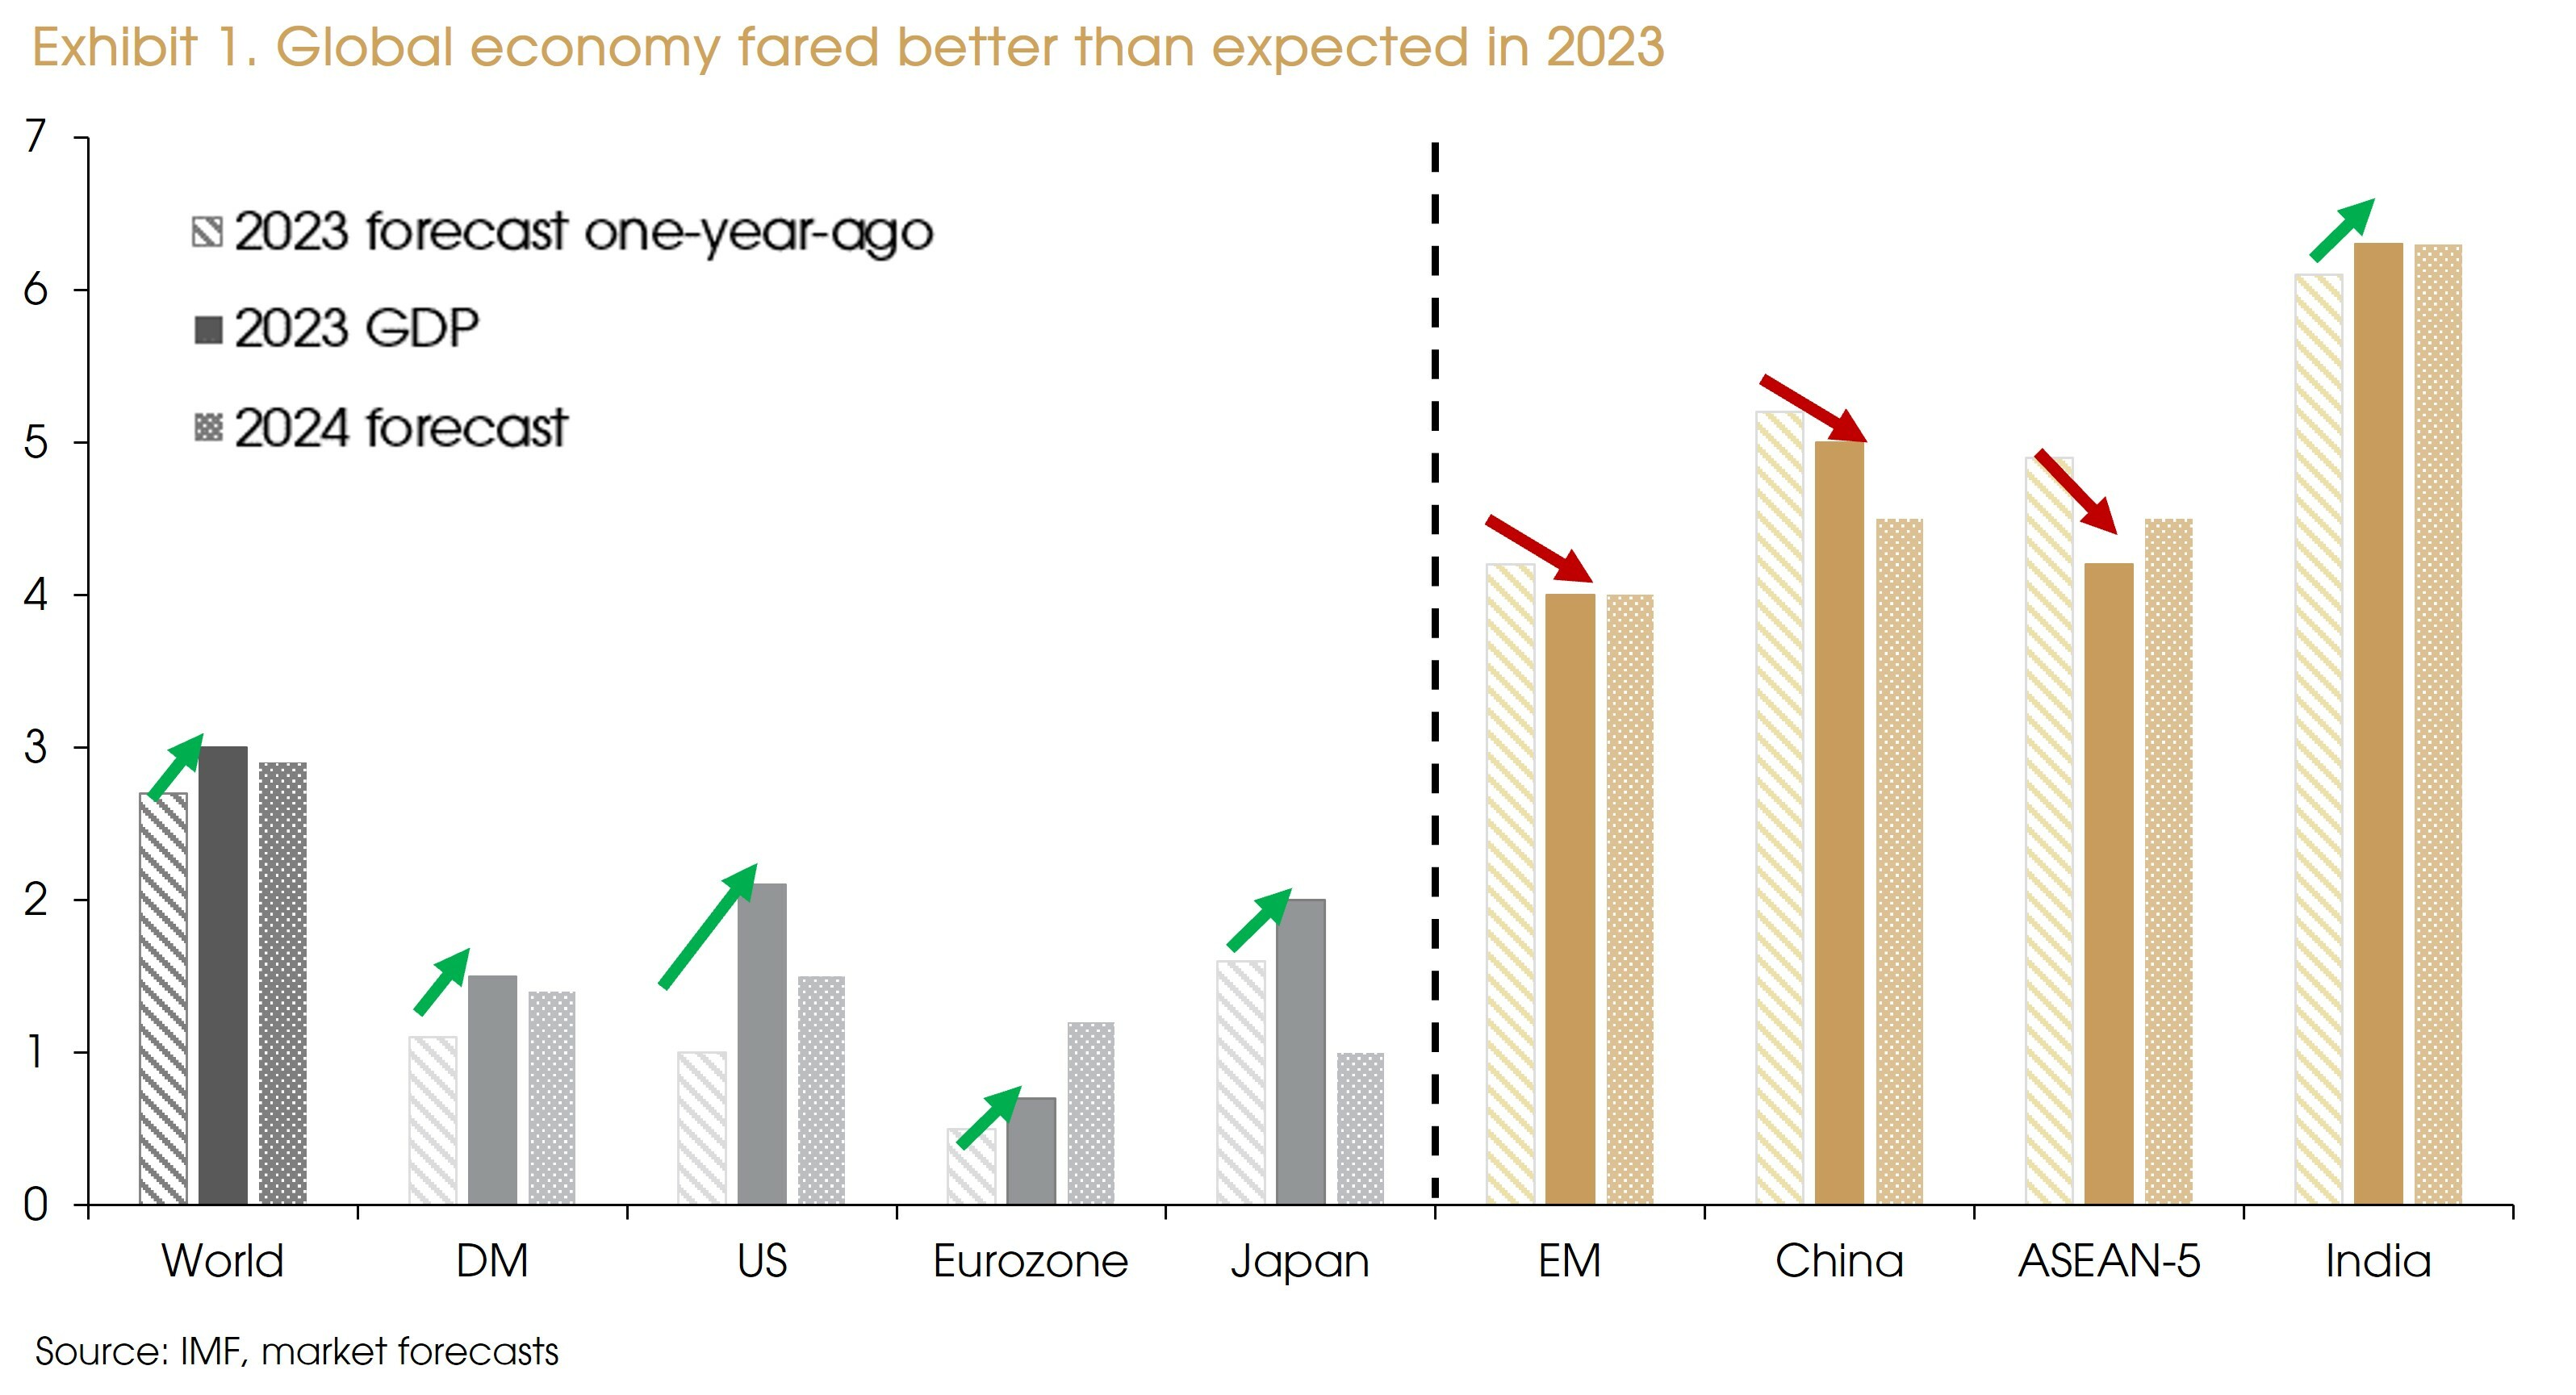
The biggest surprises in 2023 were the strength/resilience of the US economy and the disappointingly weak Chinese recovery. A year ago, the market (including us) expected a visible US downturn in 2023, mainly due to the most aggressive rate hikes in four decades. However, the combination of the rapid unwinding of inflationary pressure, the continued strength stemming from the service sector, and the positive fiscal impulse successfully offset the impact of the Fed tightening in 2023.
On the other hand, China suffered from a lack of fiscal support and continued deterioration of its property market. The highly anticipated re-opening recovery of the Chinese economy turned out to be far weaker than expected, as the rebound in the service sector (mainly tourism) failed to offset the drag from scant domestic demand.
Other emerging Asian economies, e.g., ASEAN-5, were mainly affected by fading reopening boosts, a global manufacturing downturn, a weaker China, and a strong US dollar.
The Eurozone’s economy shared a similar backdrop to that of the US. Despite a contracting Germany, the region, overall, avoided a recession. Meanwhile, as a laggard in removing COVID controls, Japan enjoyed a re-opening boost last year. The Bank of Japan maintained an accommodative stance, which helped to support a solid GDP growth in 2023.
Ensuing to the higher growth in 2023, we expect a slowing global economy in 2024. The bright spots are the anticipated rate cuts from major central banks as well as a recovery in global manufacturing activities and trade, which will both benefit emerging markets. As a consequence, GDP growth for the ASEAN-5 is expected to rebound towards its long-term trend.
However, the reopening recovery will fade in China and Japan. The lack of strong fiscal stimulus and a continued downturn in the property market suggest slowing growth in China. Meanwhile, a possible monetary tightening and a stronger yen can barely support higher growth in Japan.
The fading fiscal impulse and lingering effects from higher interest rates should result in lower growth in the US and in an improving but still weak growth in the Eurozone.
The quick rise of interest rates in the US and in Europe already caused a banking turmoil in 2023, and still makes for a key downside risk in 2024. Other risks stem from the geopolitical front. We do not expect the ongoing conflicts in Ukraine and the Middle East to significantly impact the global economy or asset prices for the time being, but future development merits close attention. The US presidential election later this year will further add to the existing geopolitical uncertainty.
2. Recession or not?
Historically, recessions followed most US hiking cycles. Although both the Fed and the ECB signaled the start of rate cuts in 2024, the recession debates continue.
On one hand, the US yield curve has been inverted for over a year, a strong recession signal. On the other hand, other data points at the resilience of the economy.
This is typical evidence showing why a recession is always hard (or even impossible) to predict, and 2024 IS ANOTHER CHANLLENGING YEAR TO MAKE FORECASTS.
That said, we lean towards the “no recession in 2024”, for three reasons:
First, the disinflation trend should continue, reducing constraints for central banks to cut rates.
Headline and core inflation kept declining in both the US and Eurozone (Exhibit 2, upper left).
The New York Fed’s Global Supply Chain Disruption Index returned to pre-pandemic levels (Exhibit 2, upper right), suggesting well-contained core goods inflation going forward. That said, although the recent Red Sea attacks are not expected to have an immediate major impact on inflation, its evolution merits further attention.
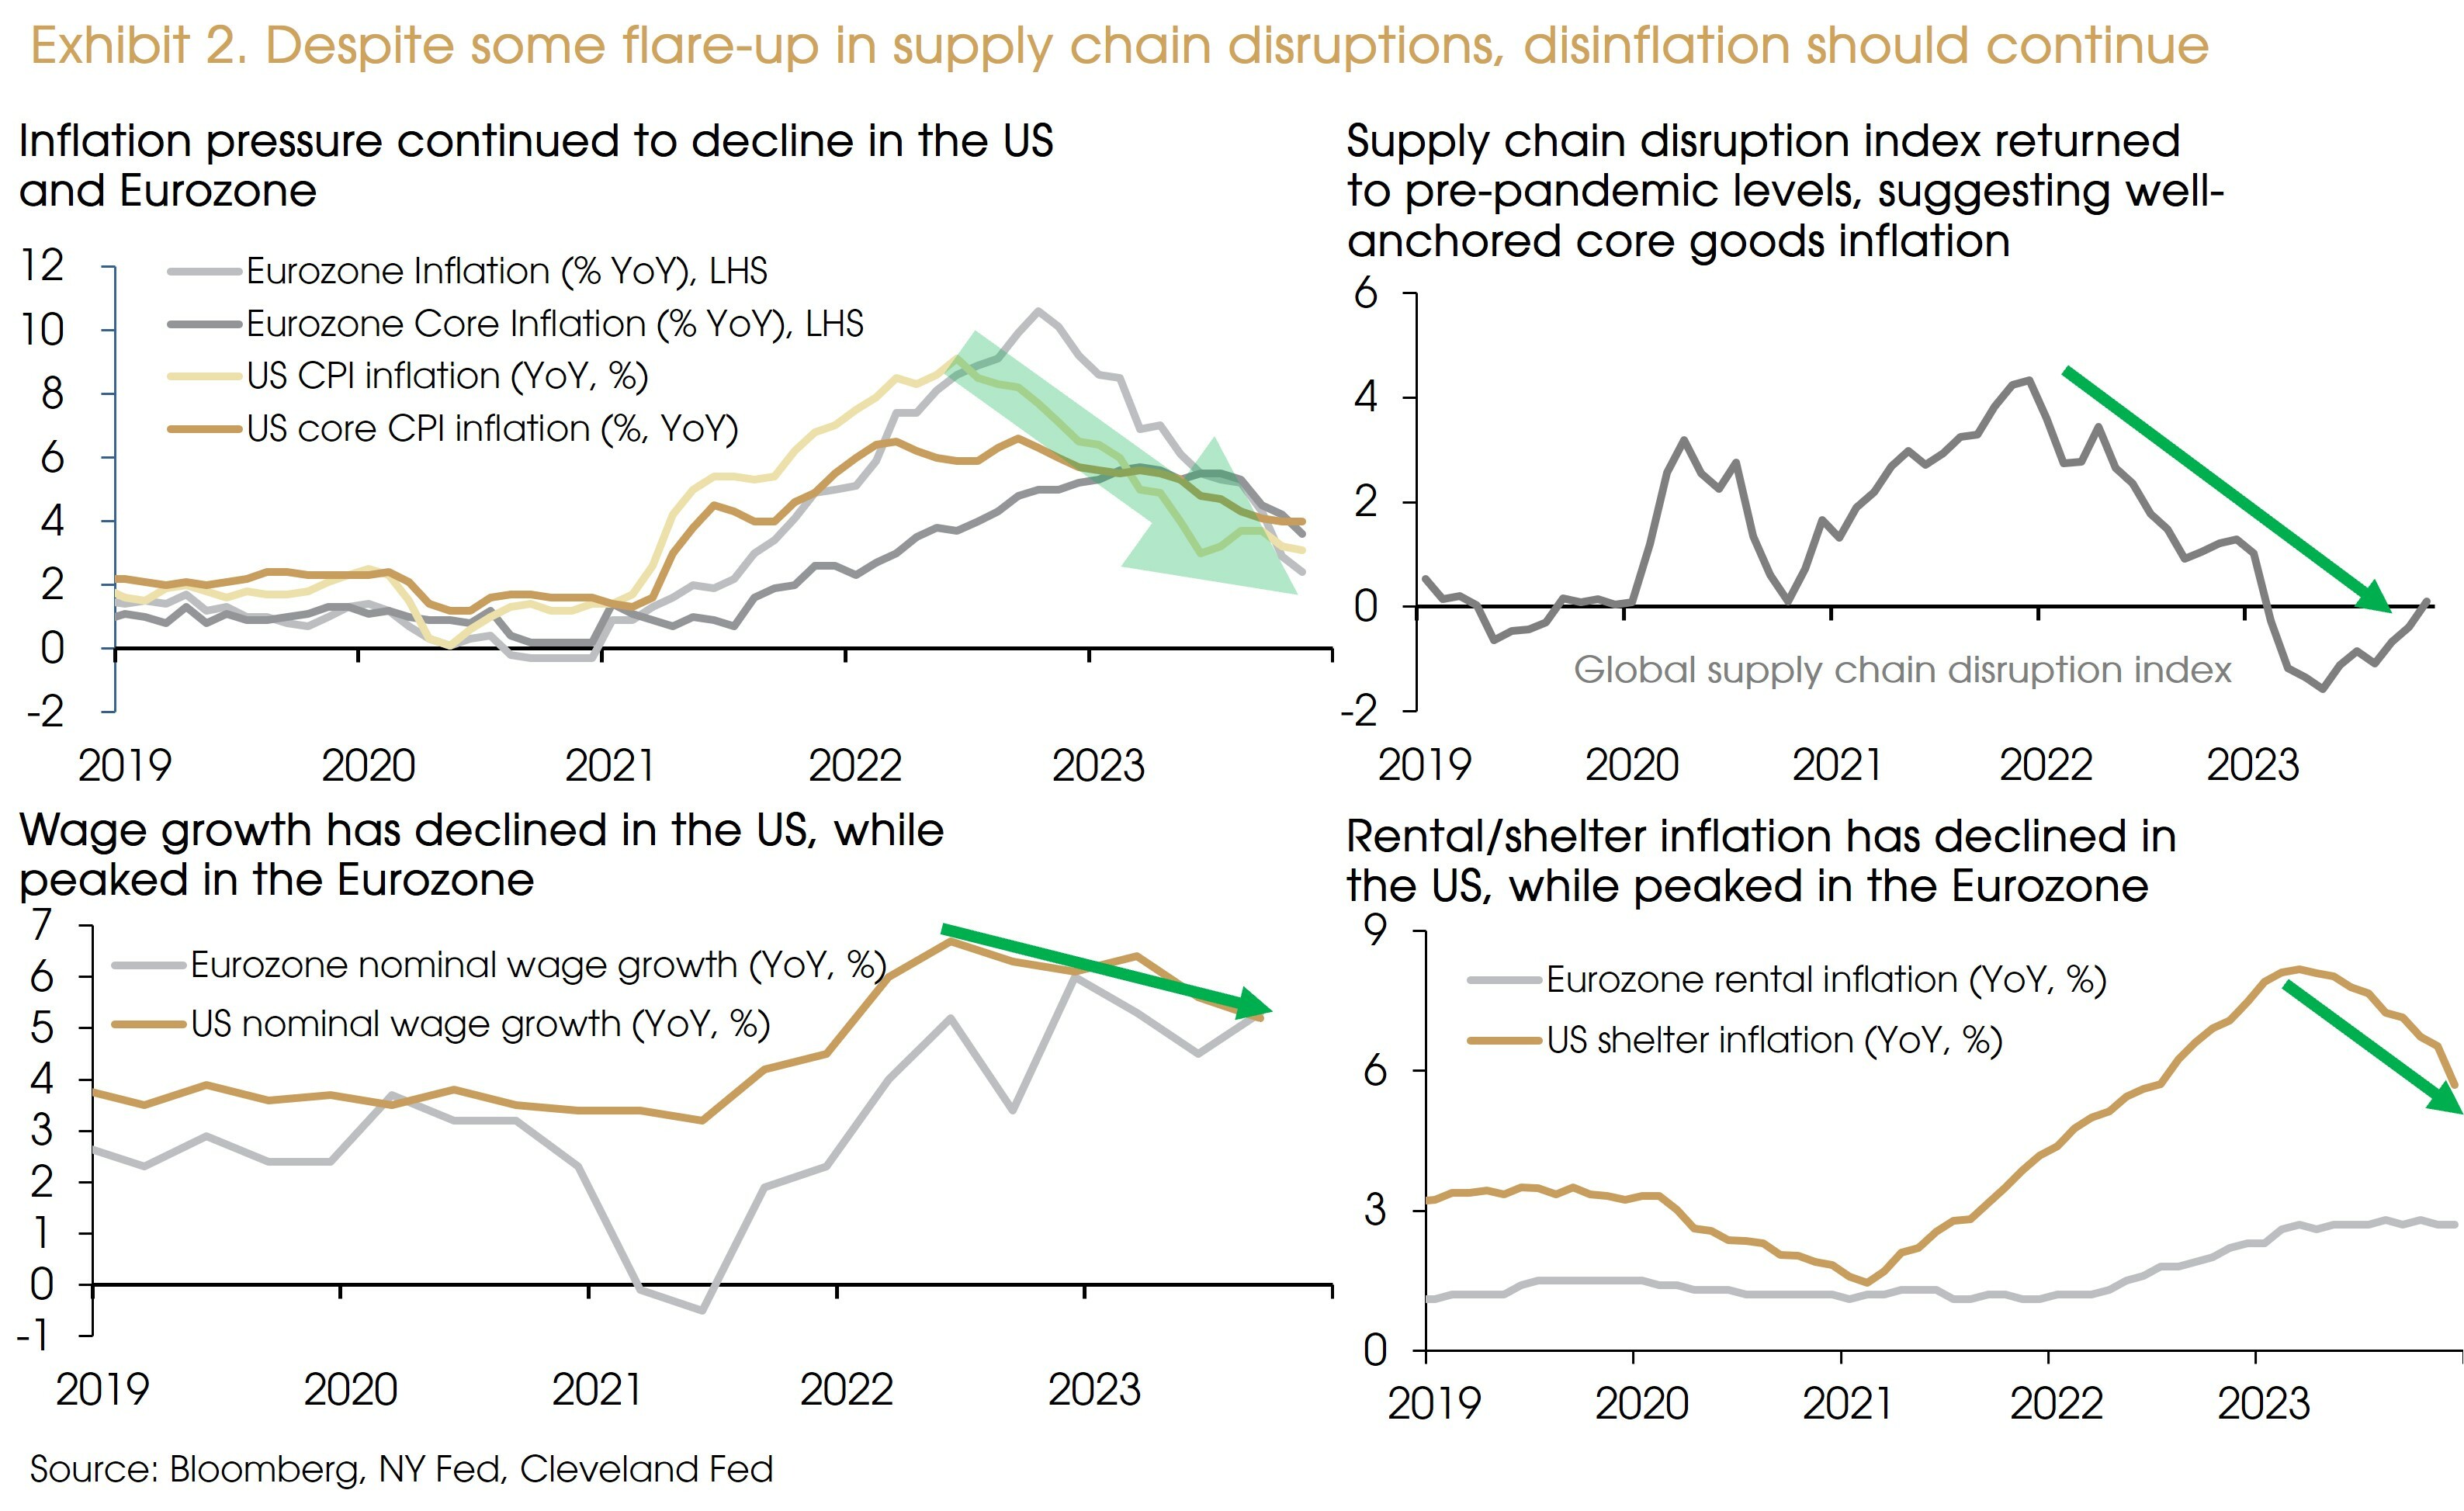
Wage growth and shelter inflation are the stickiest parts of core inflation. Both have decreased in the US while stabilizing in the Eurozone (Exhibit 2, lower panels). This should lead to further declines in core inflation and anchored inflation expectations in both economies.
The disinflation trend will gradually remove hurdles to central bank easing when needed. The surprising dovish signal from the Fed’s December meeting makes for a good example of such an evolution.
Second, a solid labor market and a manufacturing recovery should buffer any downside risks.
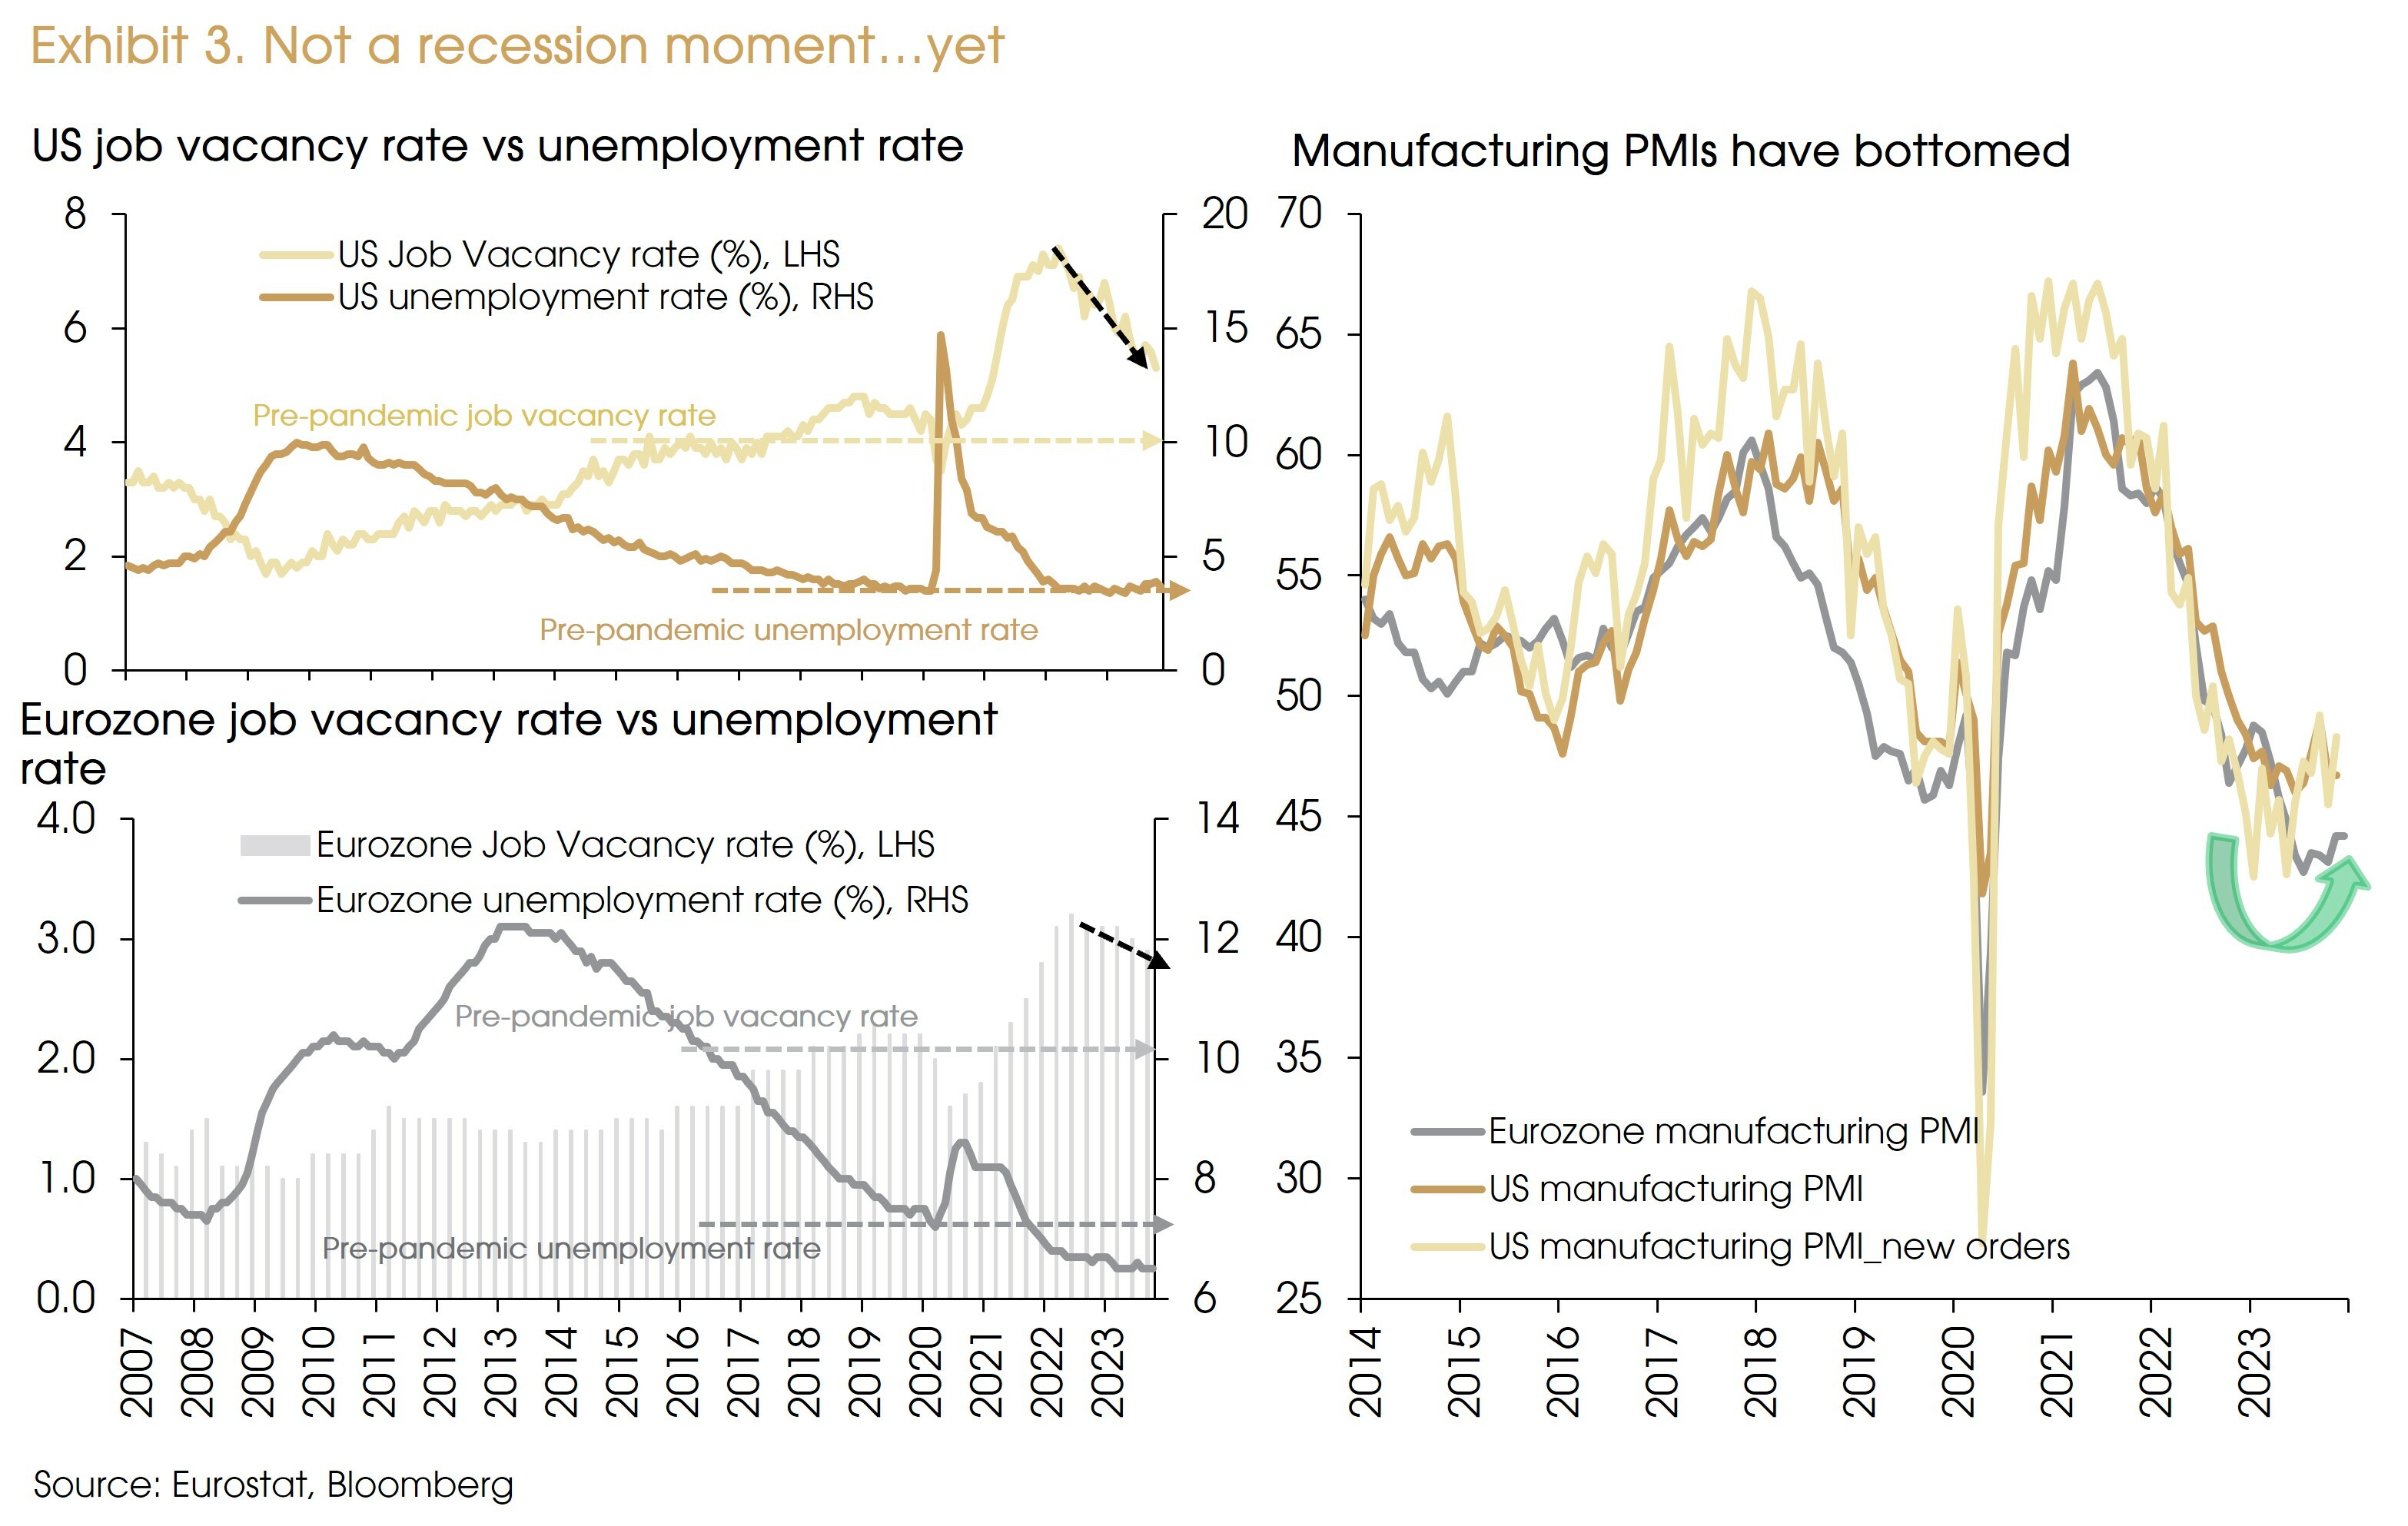
The unemployment rate is at pre-pandemic lows in the US and below pre-pandemic lows in the Eurozone (Exhibit 3, LHS). The lagging effect of monetary tightening should further reduce labor demand. However, such an adjustment has occurred almost entirely through falling job openings/vacancies, without rising unemployment rates. This should continue in the foreseeable future, as job opening rates remain well above pre-pandemic levels, which have room to further normalize without driving unemployment rates higher.
With record low unemployment rates and still higher job opening/vacancy rates, it is hard to call for a recession in the foreseeable future.
In addition, as the global inventory cycle is to bottom out in 1H 2024, this will facilitate the recovery of manufacturing activities and global trade. After a year of contraction, the manufacturing PMI, and more specifically the new orders index, showed improvements in recent months (Exhibit 3, RHS).
Finally, monetary easing will play its part in avoiding a possible significant economic downturn in 2024.
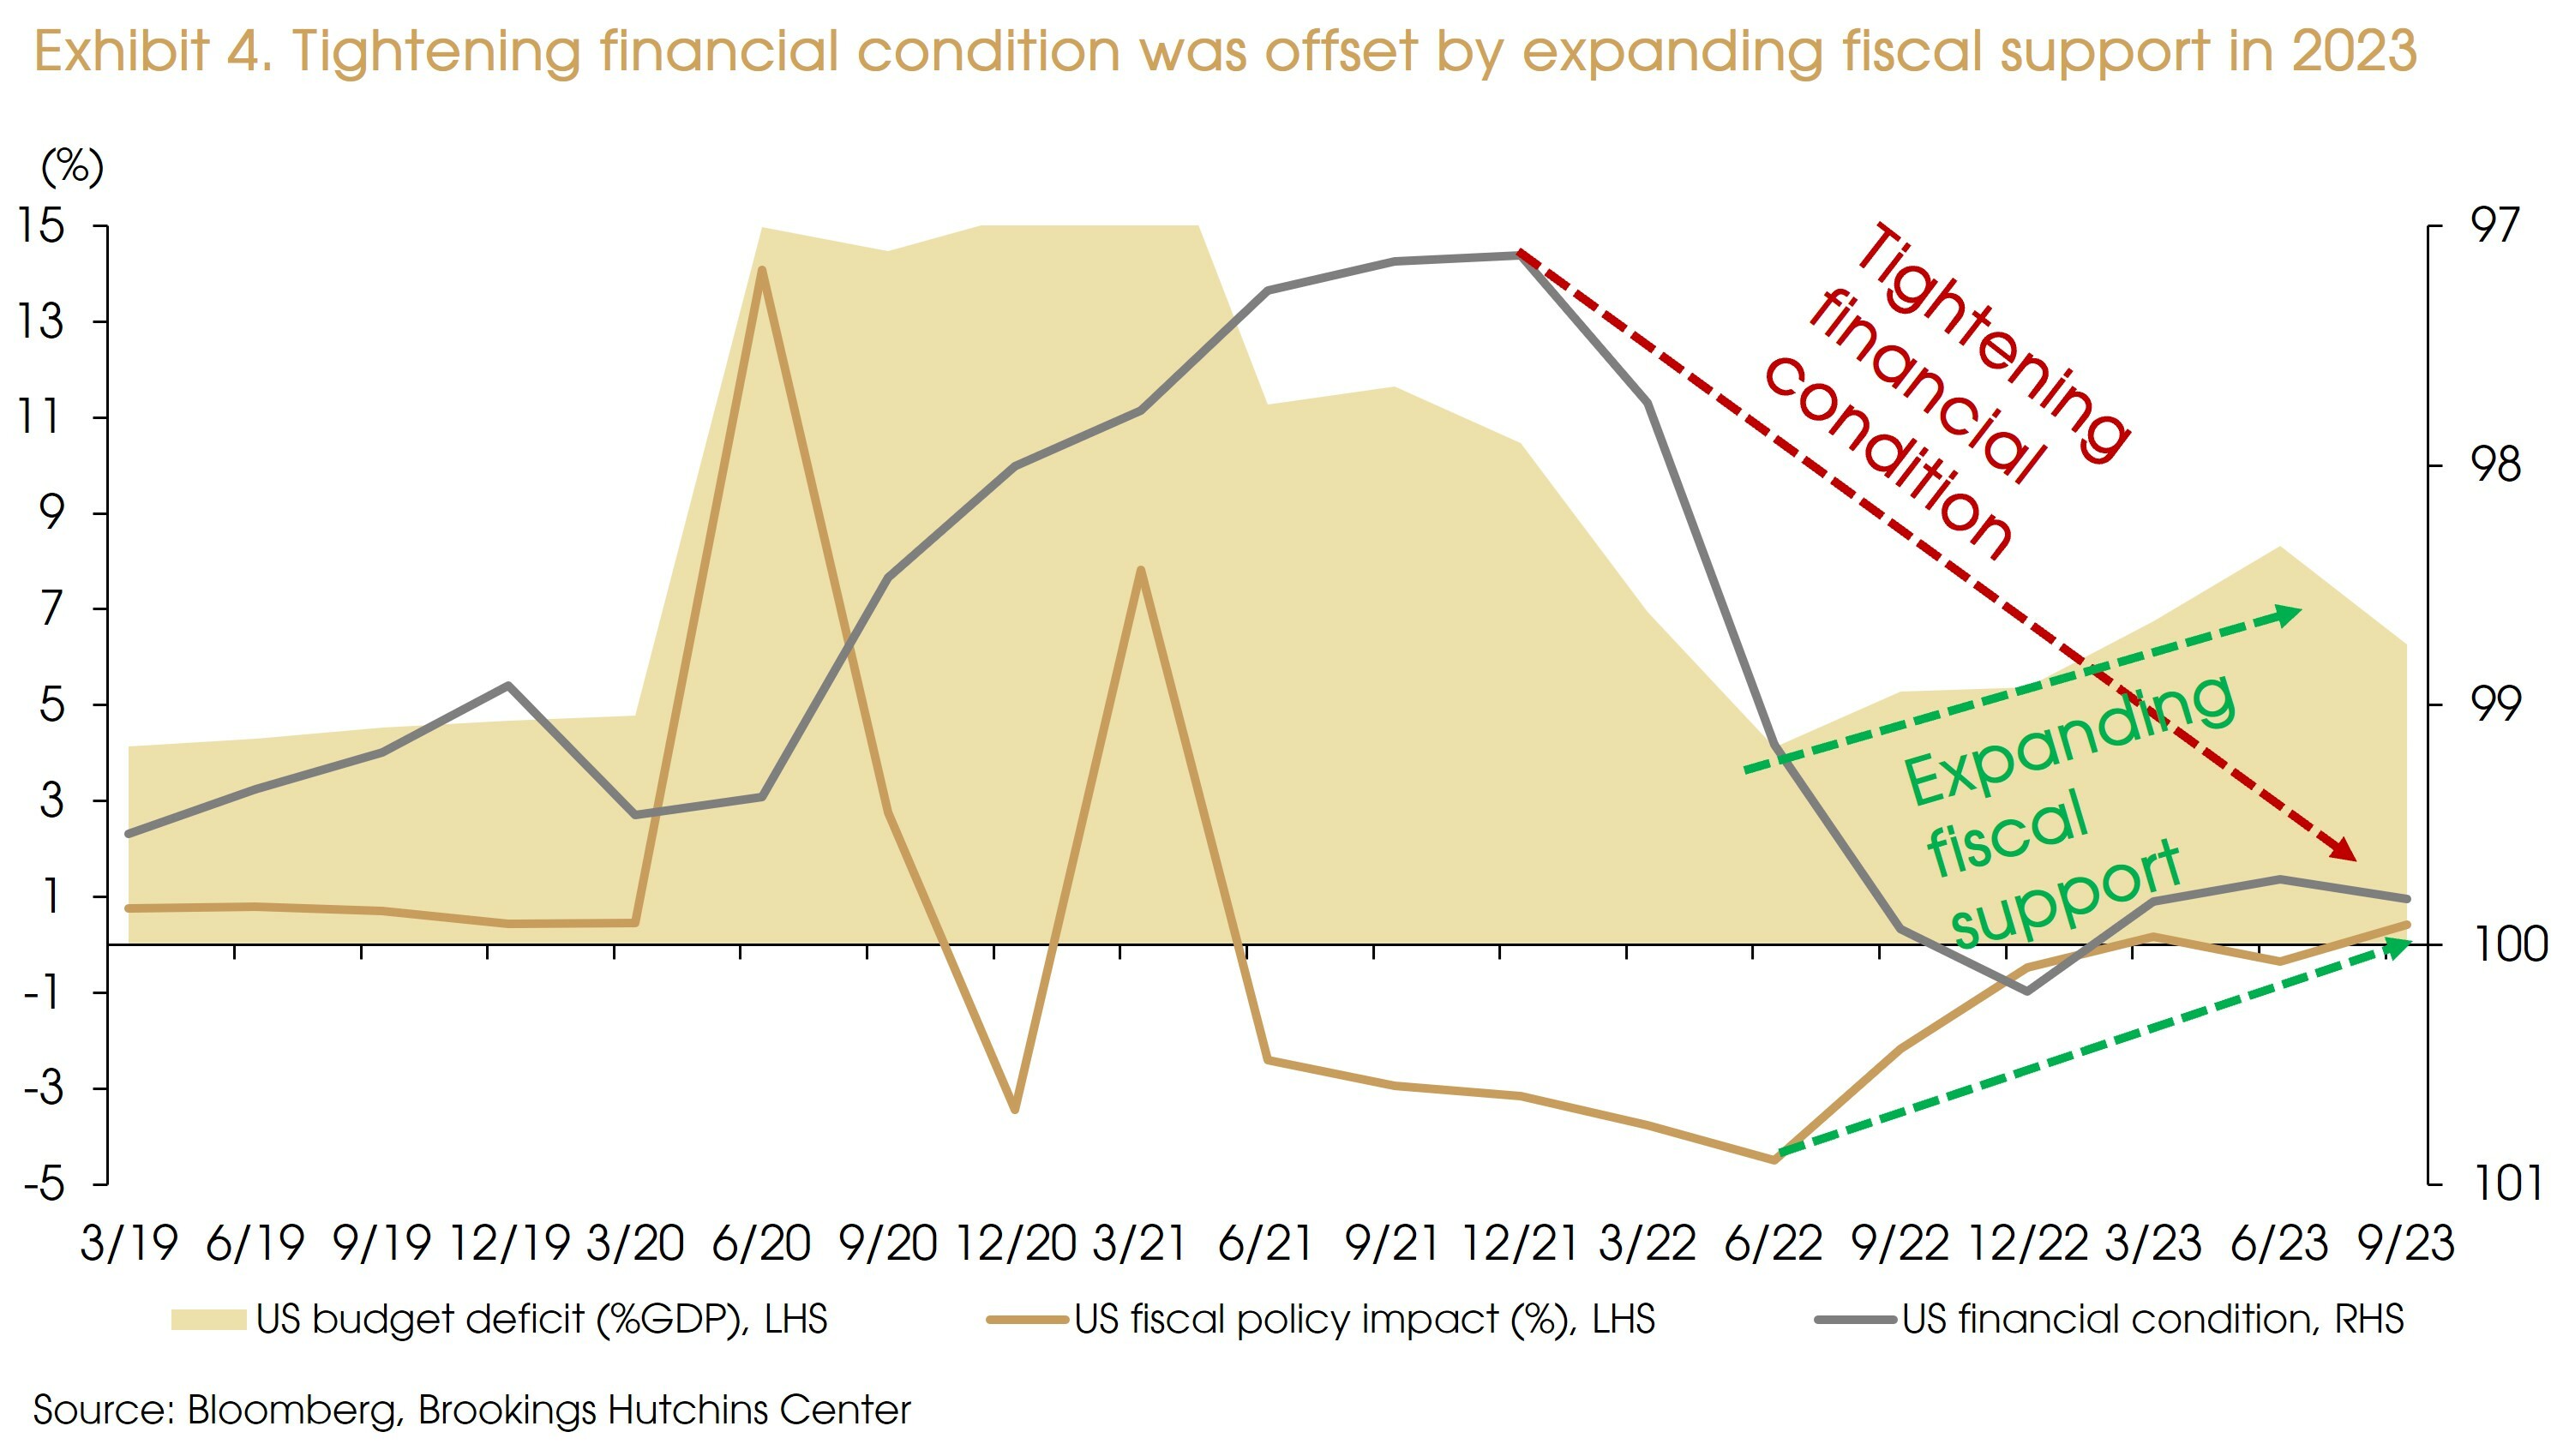
The better-than-feared US and Eurozone economic growth rates were mainly due to fiscal expansions (especially after the banking turmoil) (Exhibit 4). In 2024, fiscal support will fade as high government debt levels and political concerns set hard constraints on fiscal spending. However, monetary easing will guard against downside risks.
3. The start of an easing cycle will lower interest rates
Our base case for 2024 is for no recession to occur, whether it being in the US or in the Eurozone. That said, monetary tightening has caused declines in bank lending, rising bankruptcies, and increasing delinquency rates. As a result, a visible slowdown in the US is unavoidable, prompting the Fed to kick off a new easing cycle. Thus, short-term interest rates should significantly decline, but we see limited downside for long-term interest rates, unless a recession happens (Exhibit 5).
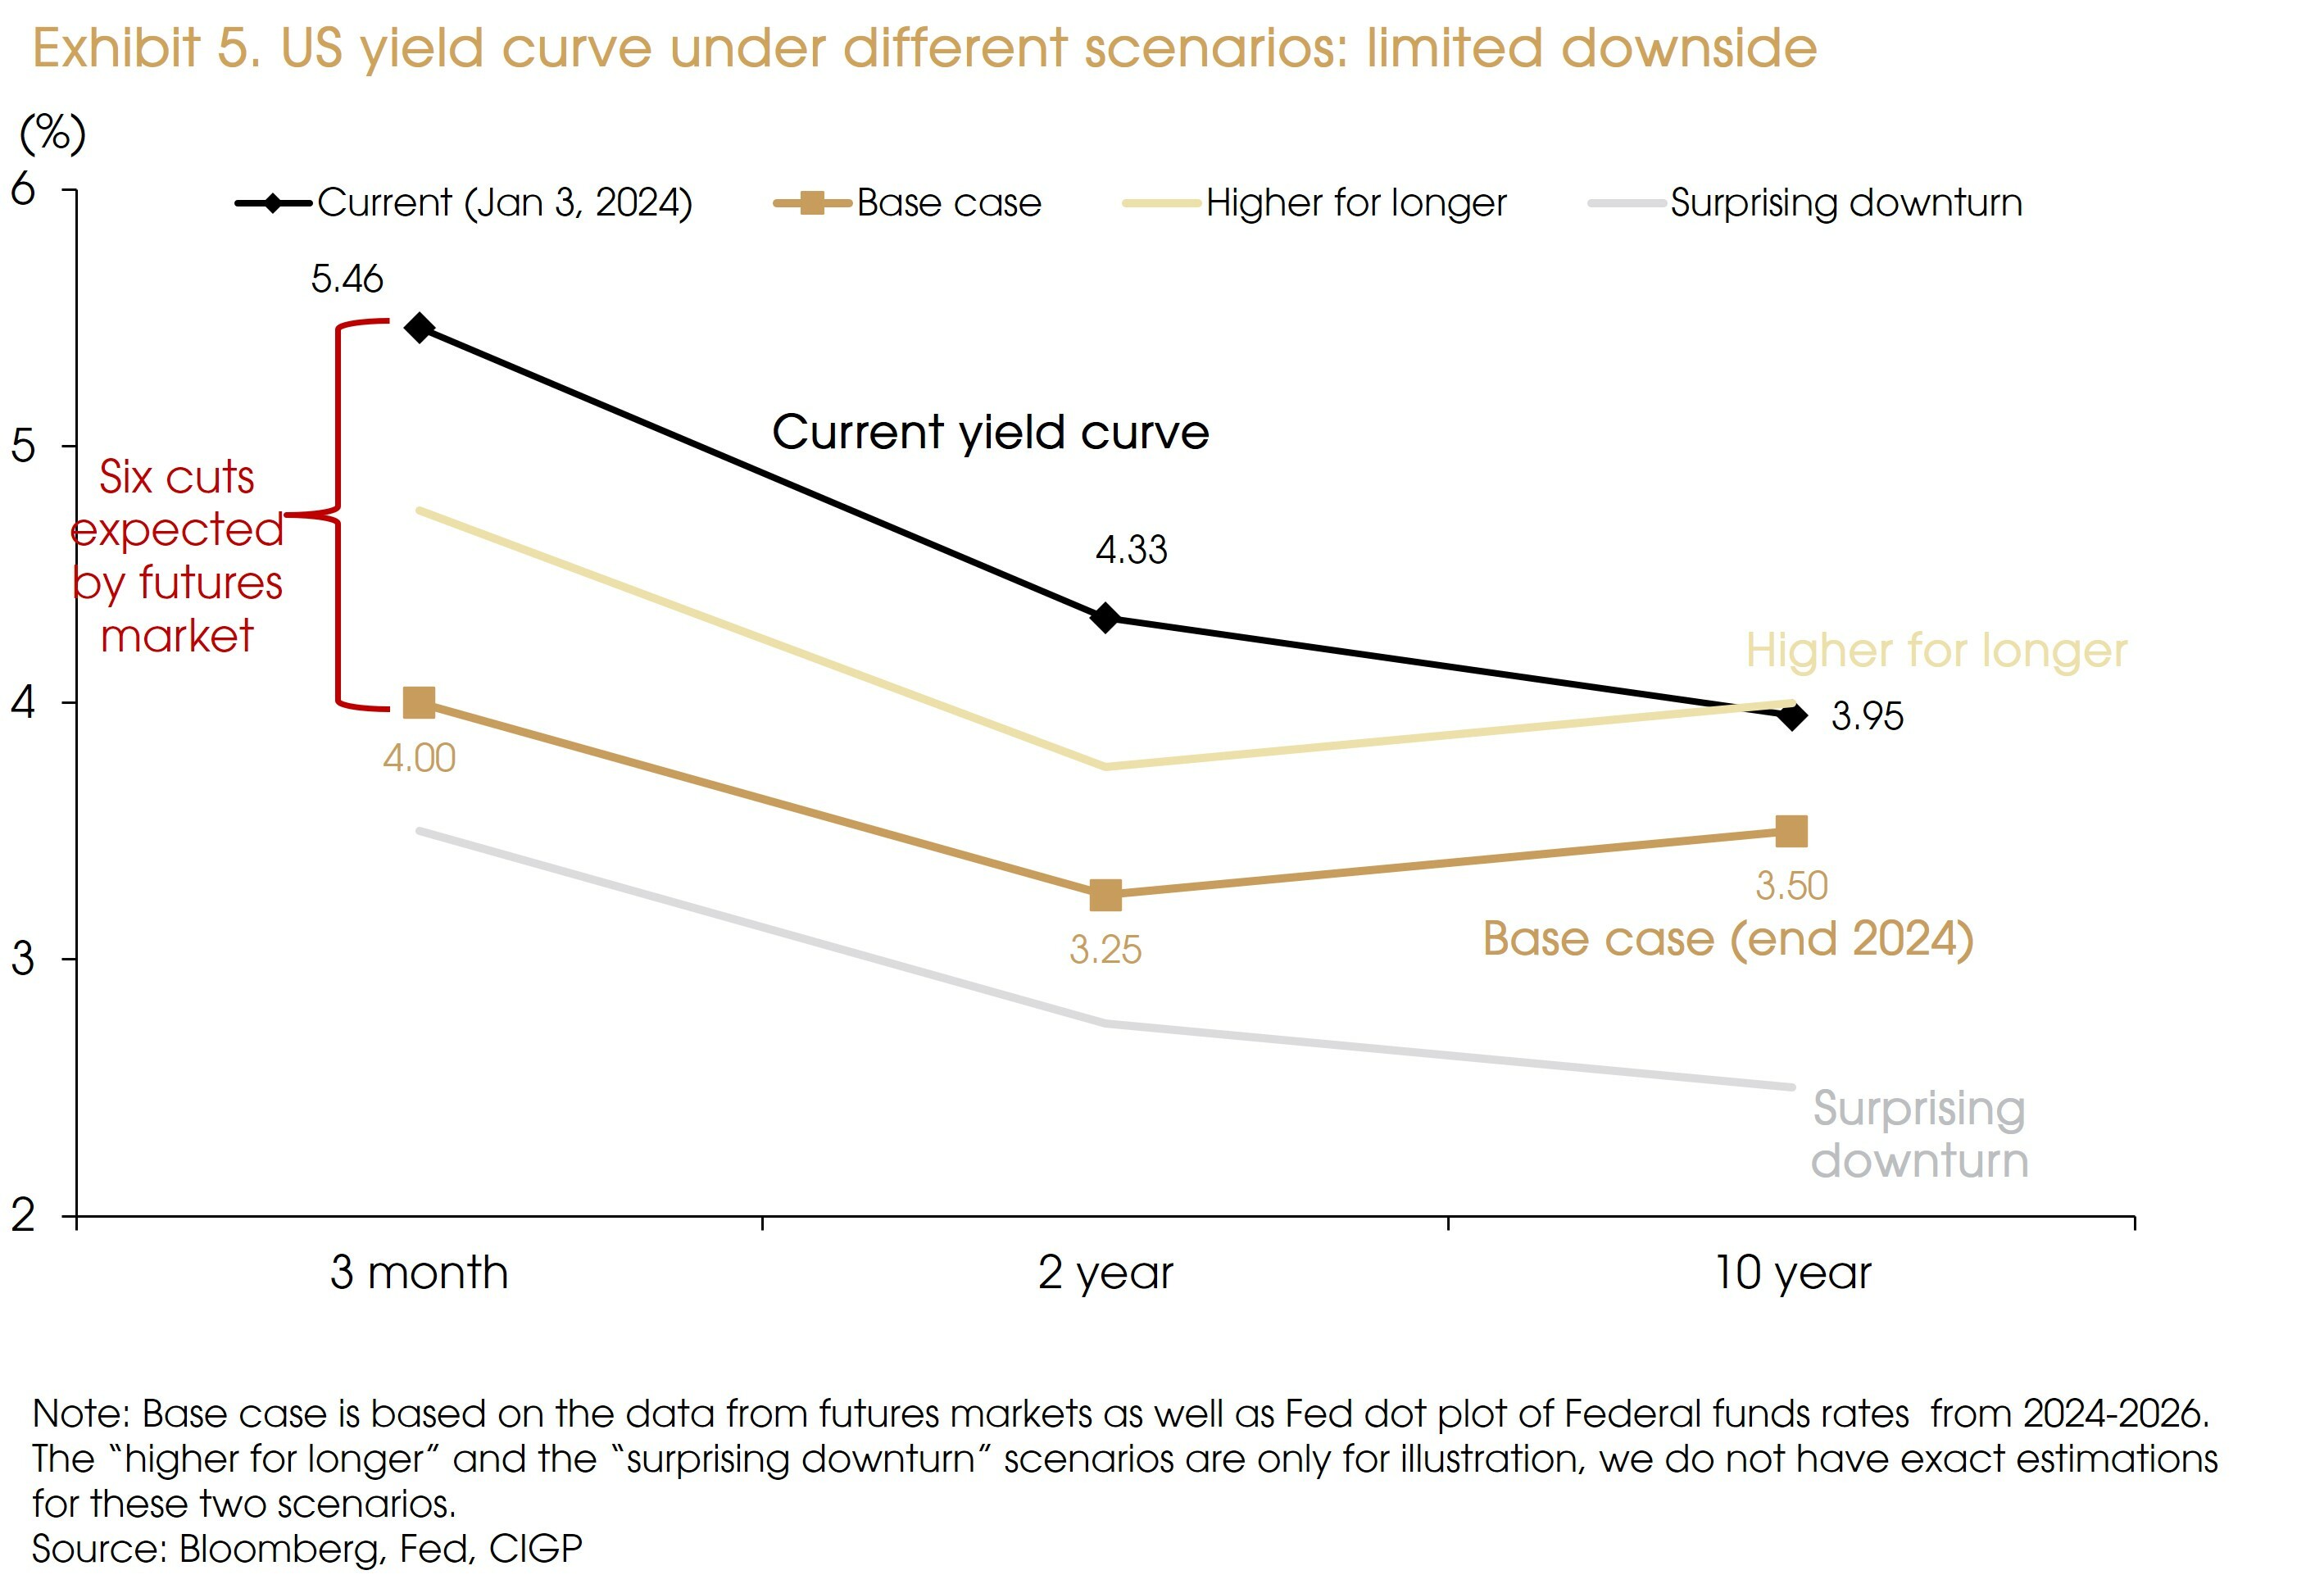
Under our base case, the Fed may deliver six 25-bps cuts to bring policy rates to 3.75-4% (according to the futures market). The 3-month treasury yield should then decrease to ~4%.
Given the Fed’s latest forecast, average policy rates will stay at ~3.25% between 2024-2026, a good estimate for the 2-year treasury yield.
Longer-term yields, e.g., 10-years, are also to decline. However, as the market continues to price out recession concerns, the yield curve should steepen with the 10y-2y spread turning positive. The current futures market suggests a ~+20 bps 10y-2y spread, ~3.5% for the 10-year treasury yield.
Another case considered by market players would see the US growth surprise to the upside, leading to fewer rate cuts, i.e., “higher for longer”. Under these circumstances, the yield curve will reside at higher levels, with further upsides on the long-term yields.
Finally, should the US step into a recession, we expect additional rate cuts to push the yield curve lower. Longer-term yields should decline further (e.g., below 3%) as the recent yield curve steepening unwinds.
Overall, under no-recession scenarios, the reduced downside risks should limit the decline in long-term yields.
4. Tailwinds for equities
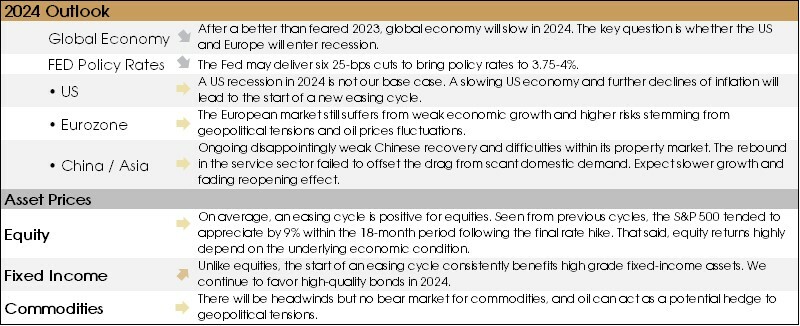
The end of the hiking cycle and the start of rate cuts are generally positive for equities.
Exhibit 6 (LHS) shows the S&P500 performance in the 18 months following the final rate hike, during the eight cycles experienced since 1980.
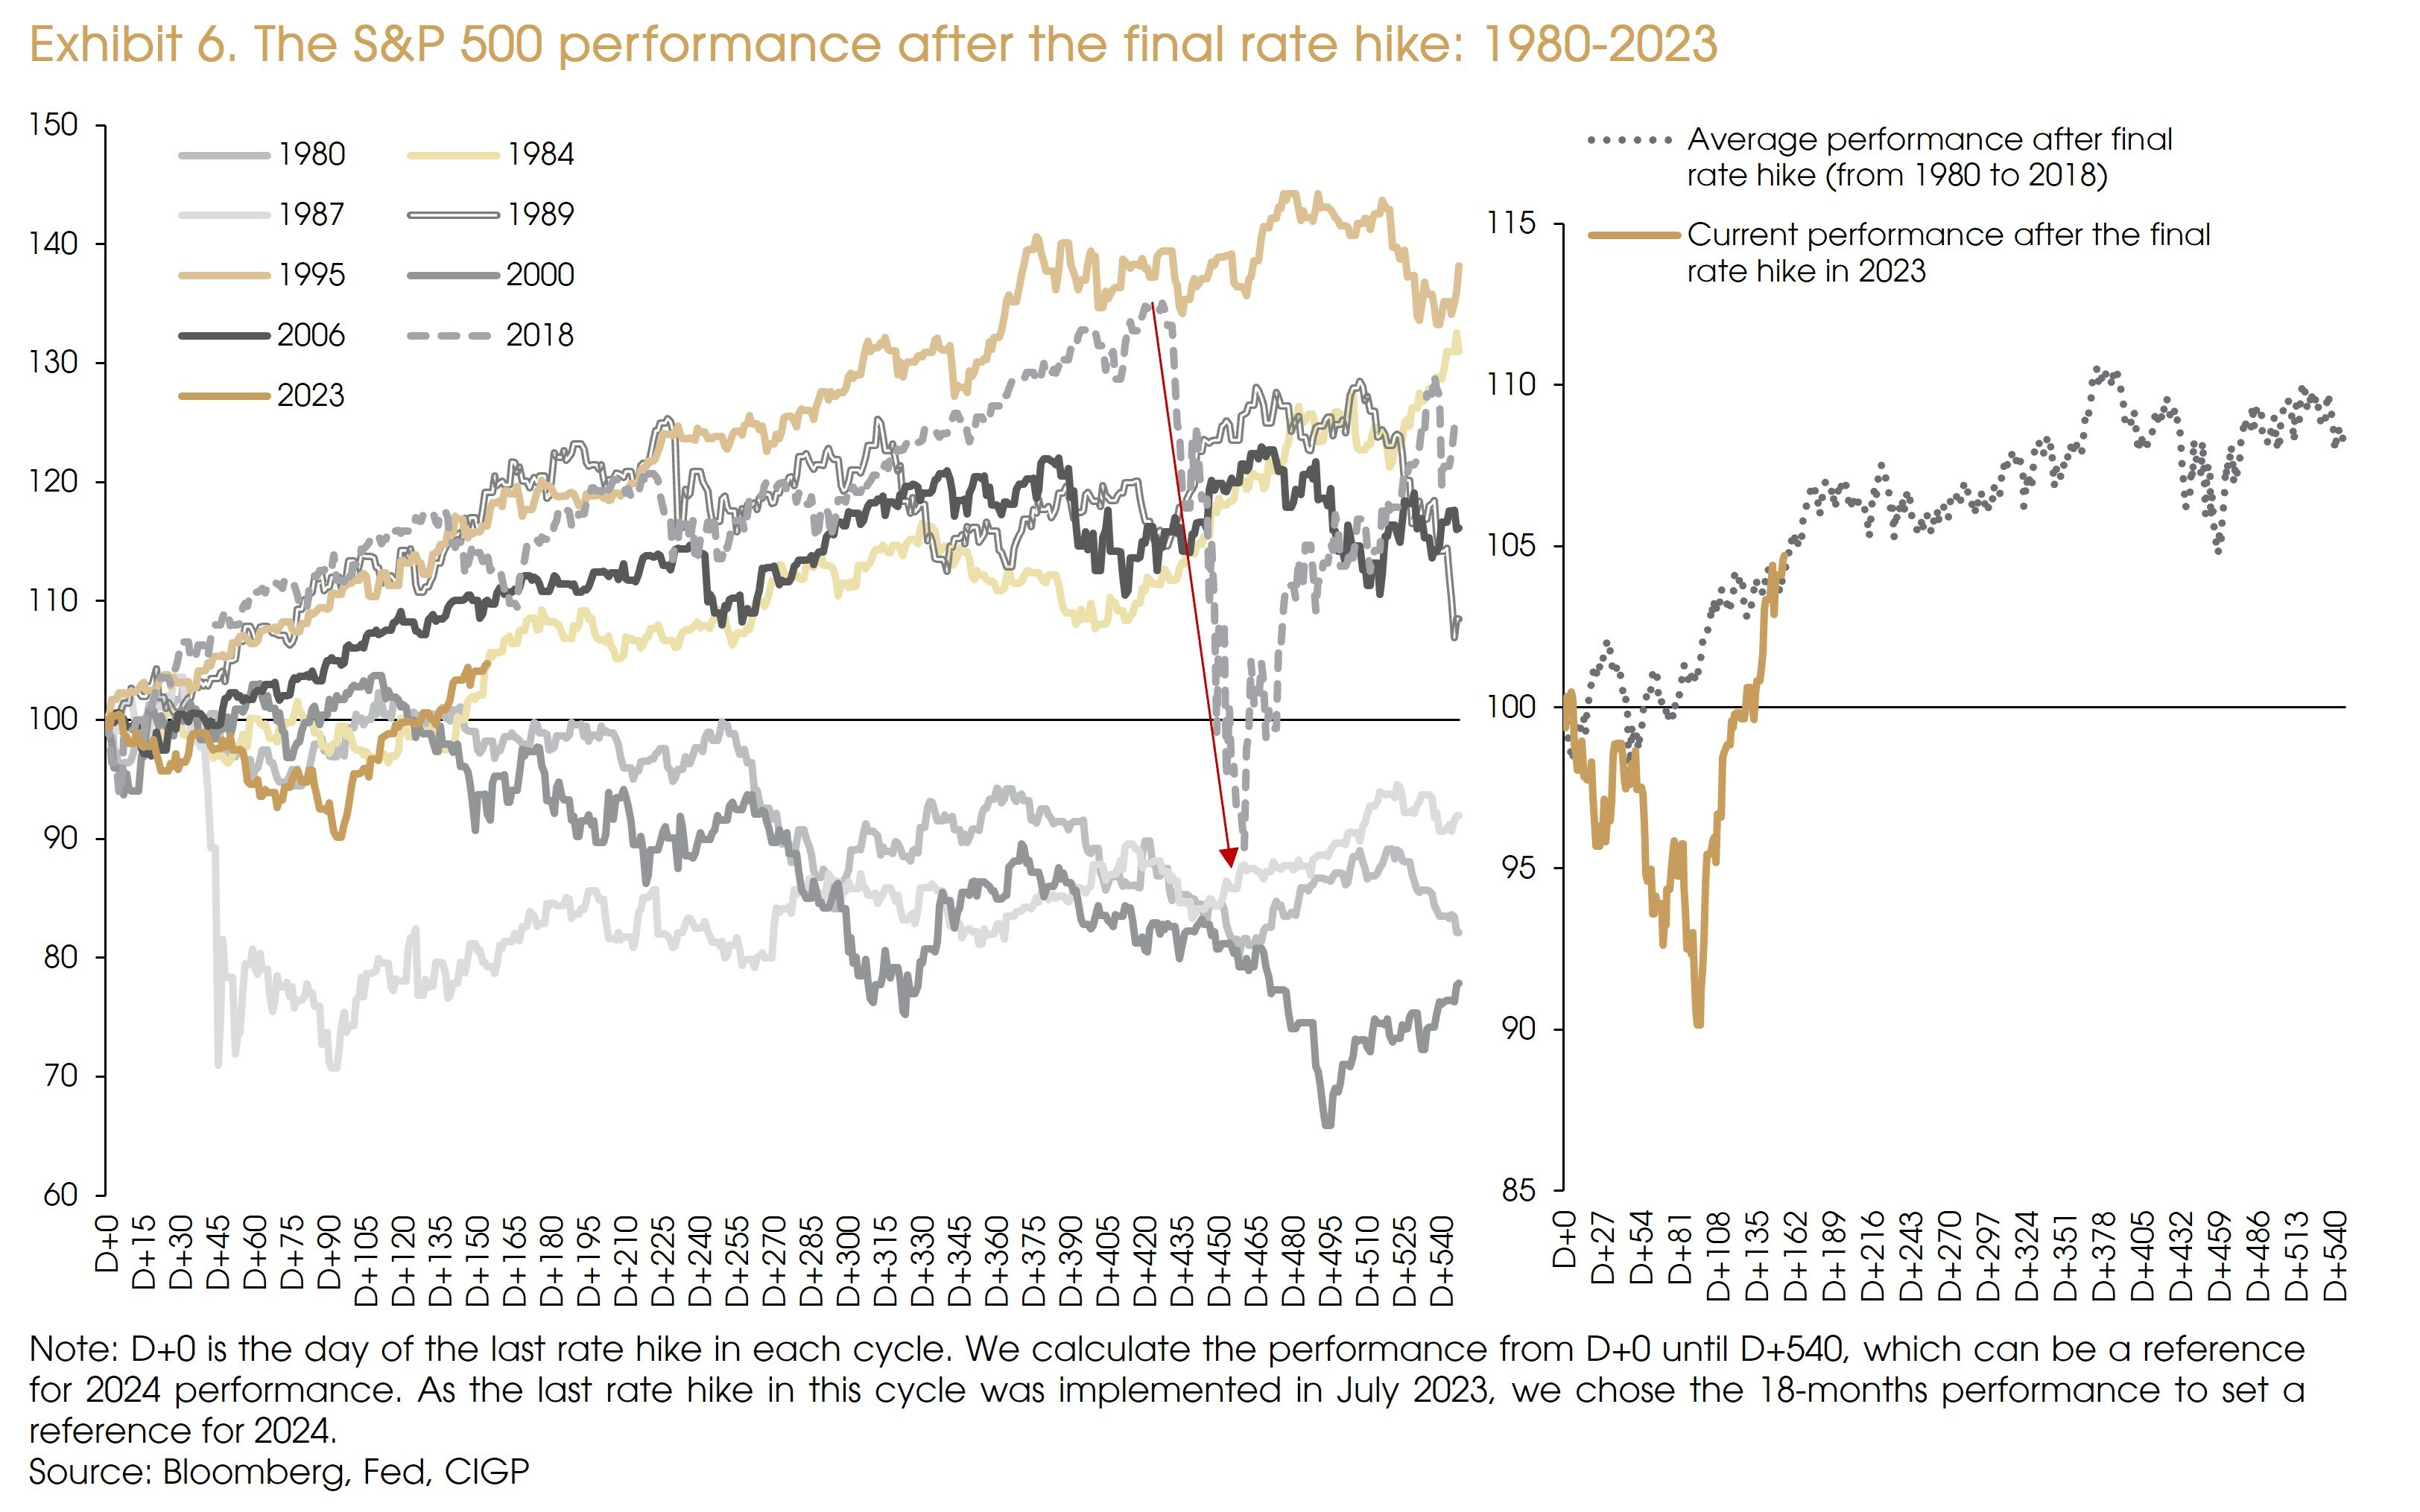
For 1980, 1989, 2000, and 2018, recessions occurred within 18 months after the final rate hike. The 18-month returns that followed the 1980 and 2000 last hikes were negative. Meanwhile, returns in the 1989 and 2018 instances were positive, supported by a mild recession in 1989 and quick policy responses in 2020. However, significant drawdowns happened in both instances.
The 1987 case was a typical non-recession bear market caused by technical failure.
The 1984 and 1995 periods were soft-landing cases, resulting in the highest 18-month returns. Meanwhile, although the 2006 final rate hike was also followed by a deep recession, it occurred after the 18-month period..
Therefore, no severe drawdown happened during the period.
On average, the S&P 500 appreciated by 9% within the 18-month period following the final rate hike (Exhibit 6, RHS). More deteriorations in the economy/market will more likely lead to negative performance this year, while quick policy response can be a hedge to the downside.
Some may expect significant valuation expansions after the central bank pivot. However, data from the previous cycles does not support such a view. Valuation significantly dropped during most periods of recession. In the 1995 soft-landing case, valuation expansion was muted despite a 10% fall in 10-year yield. The only sizable valuation expansion happened in 2020, ensuing aggressive monetary easing.
Therefore, under our base case scenario (no recession and six rate cuts), the S&P 500 should slightly exceed the 5000 level (Exhibit 7), entirely driven by the 6% EPS growth (market consensus on top-down estimates).
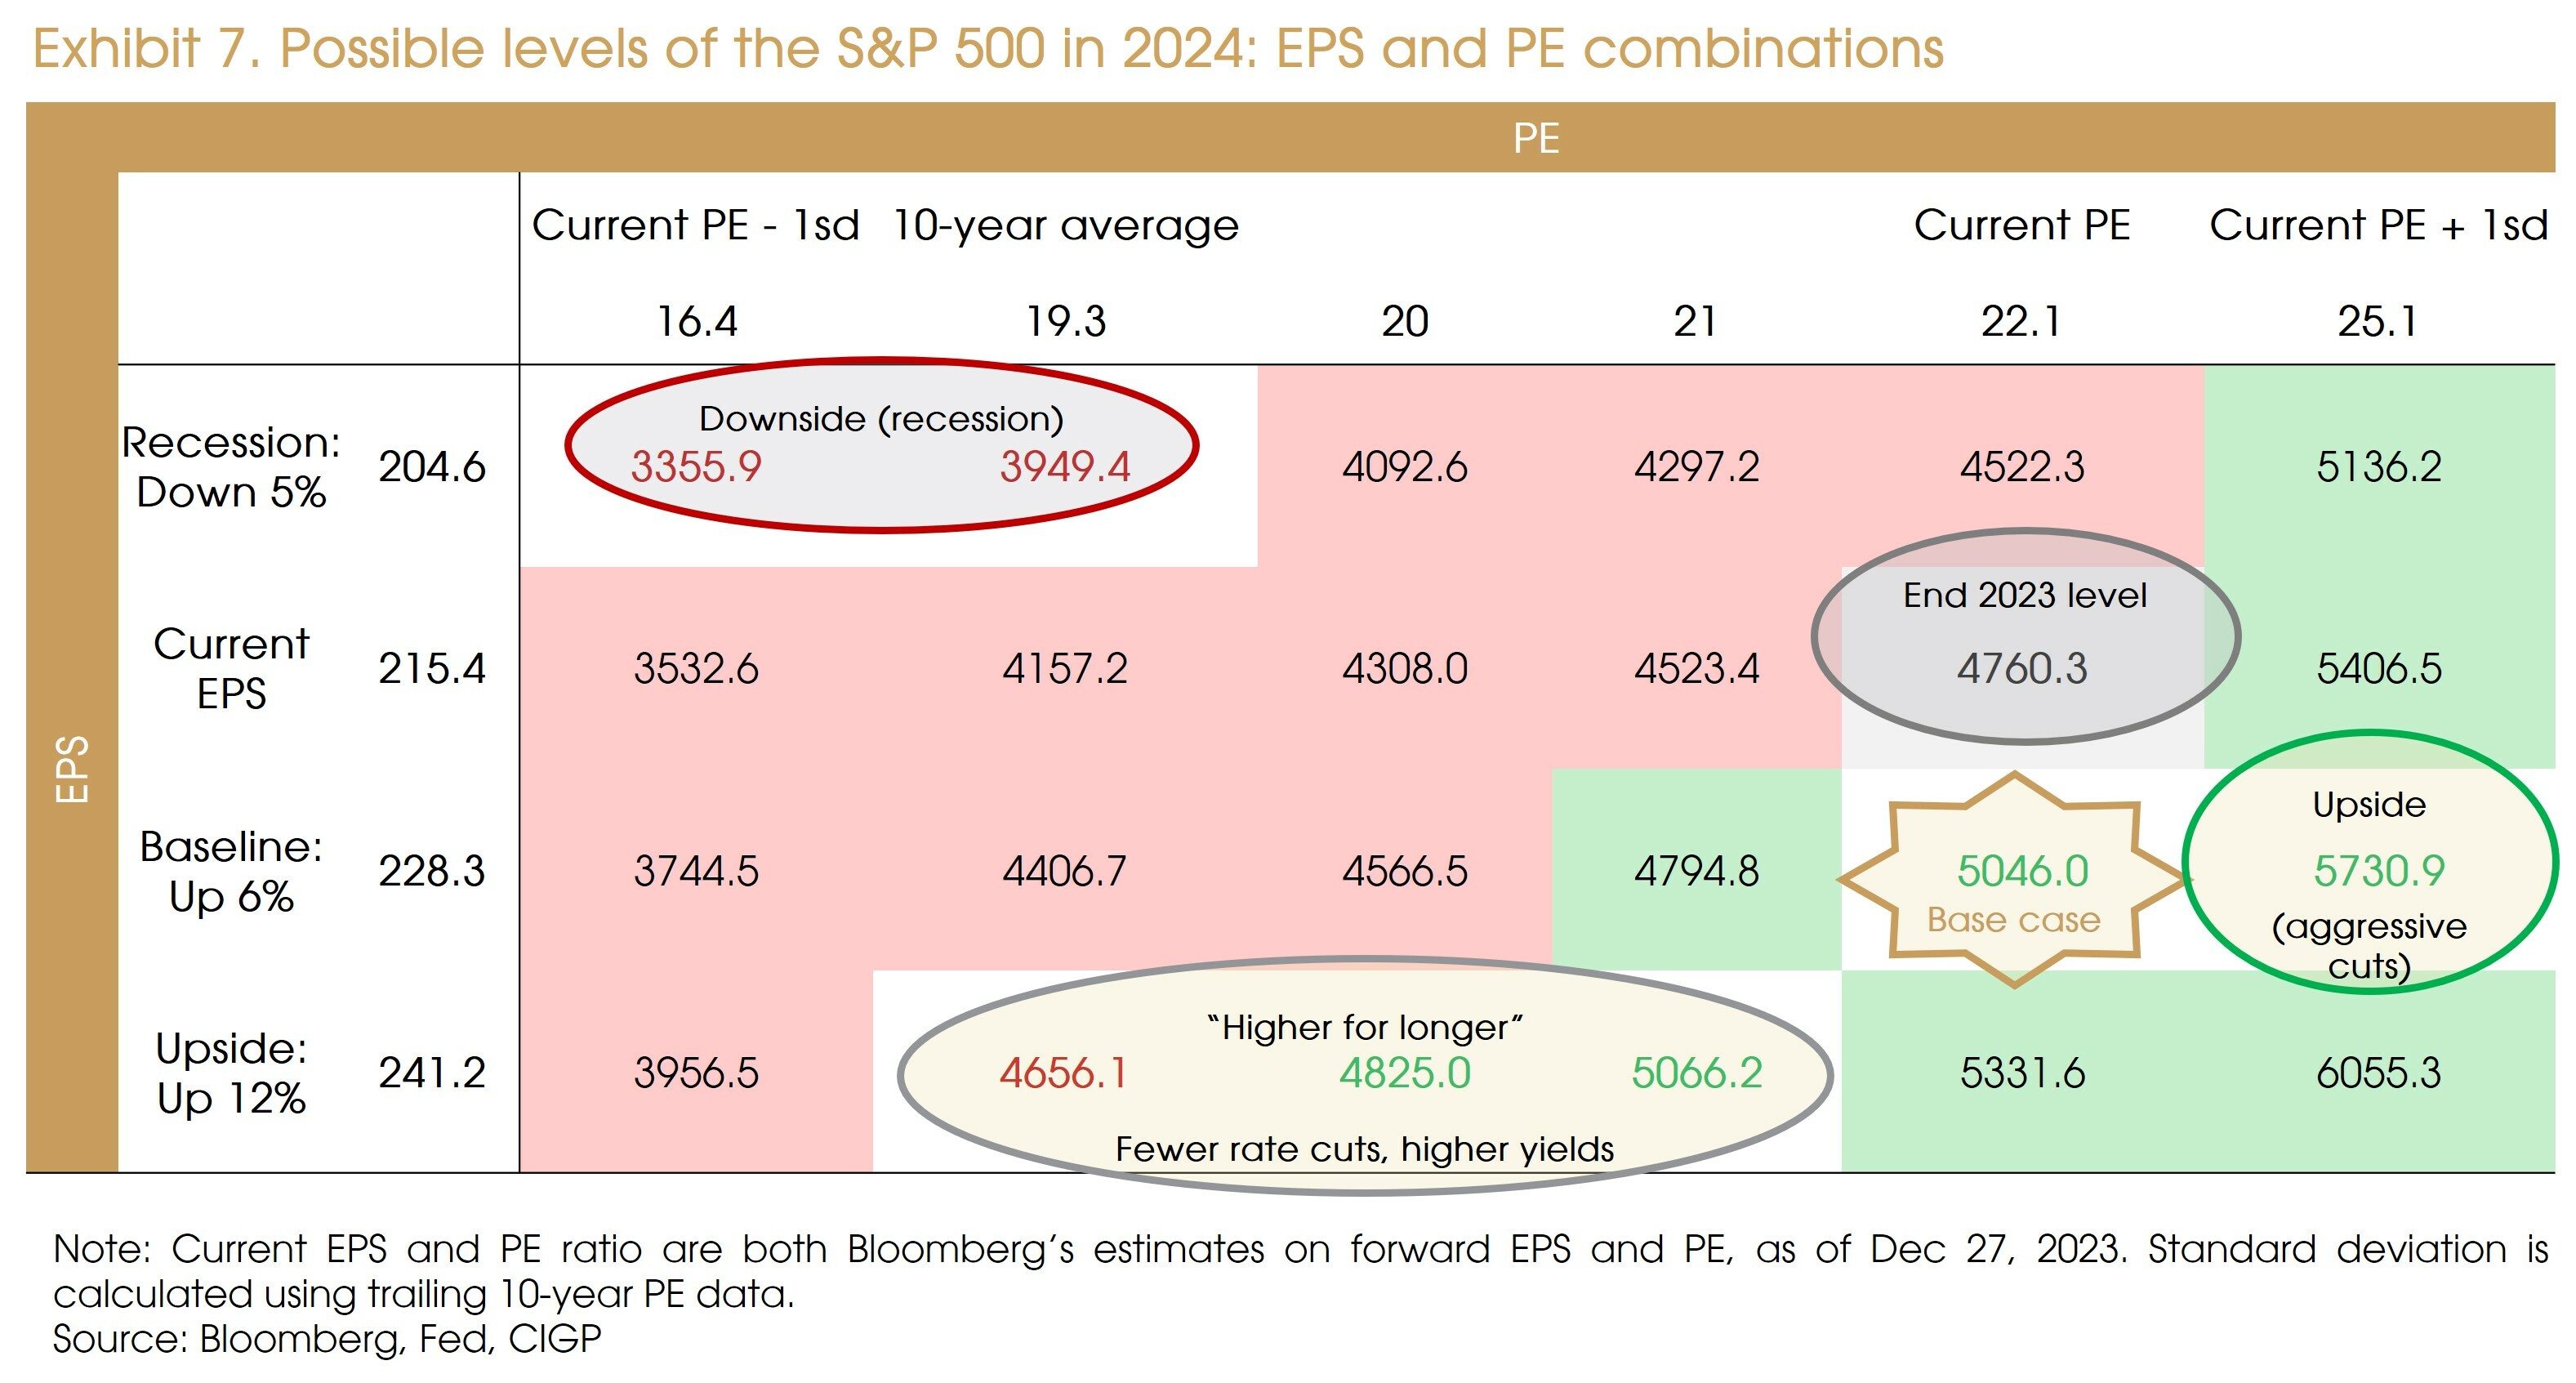
The “upside risk” is that inflation falls quicker than expected while the economy remains stable, and the Fed makes additional cuts. In that case, valuation could expand by another standard deviation to 25x, and the S&P 5000 may reach 5700 (+20% from the end-2023 level).
Under the “higher for longer” scenario (stronger economy and fewer rate cuts), EPS growth may exceed above 10% (the more optimistic bottom-up estimate in the market), but long-term yields may go up, reducing valuation. Equity performance should be similar to the base case.
Should a notable recession occur, both valuation and EPS will decline, for the market to see the S&P 500 fall below the 4000-level.
Overall, we expect a moderate upside (mid to high single-digit return) in the US market for 2024. Risks are slightly skewed to the downside, given the “higher for longer” scenario, the remaining recession concerns, and the already elevated market sentiment.
The first rate cut and underpinning Fed reasoning for enacting it should provide some indication as to which of the scenarios described above is about to unfold.
Exhibit 8 shows asset performances after the first cut during previous cycles. We did not include the 1987, 2000, and 2020 cases, as the respective technical failure, severe asset bubble, and big external shock are less relevant to the 2024 situation.
Short-term equity performance ensuing to the first cut can be a good indicator of the underlying economic condition. 3-month returns (especially the US and European ones) were negative during notable recession periods and positive under mild recession or soft-landing cases. Such positive/negative performance trends generally persisted over a 6-month and 9-month time-frame.
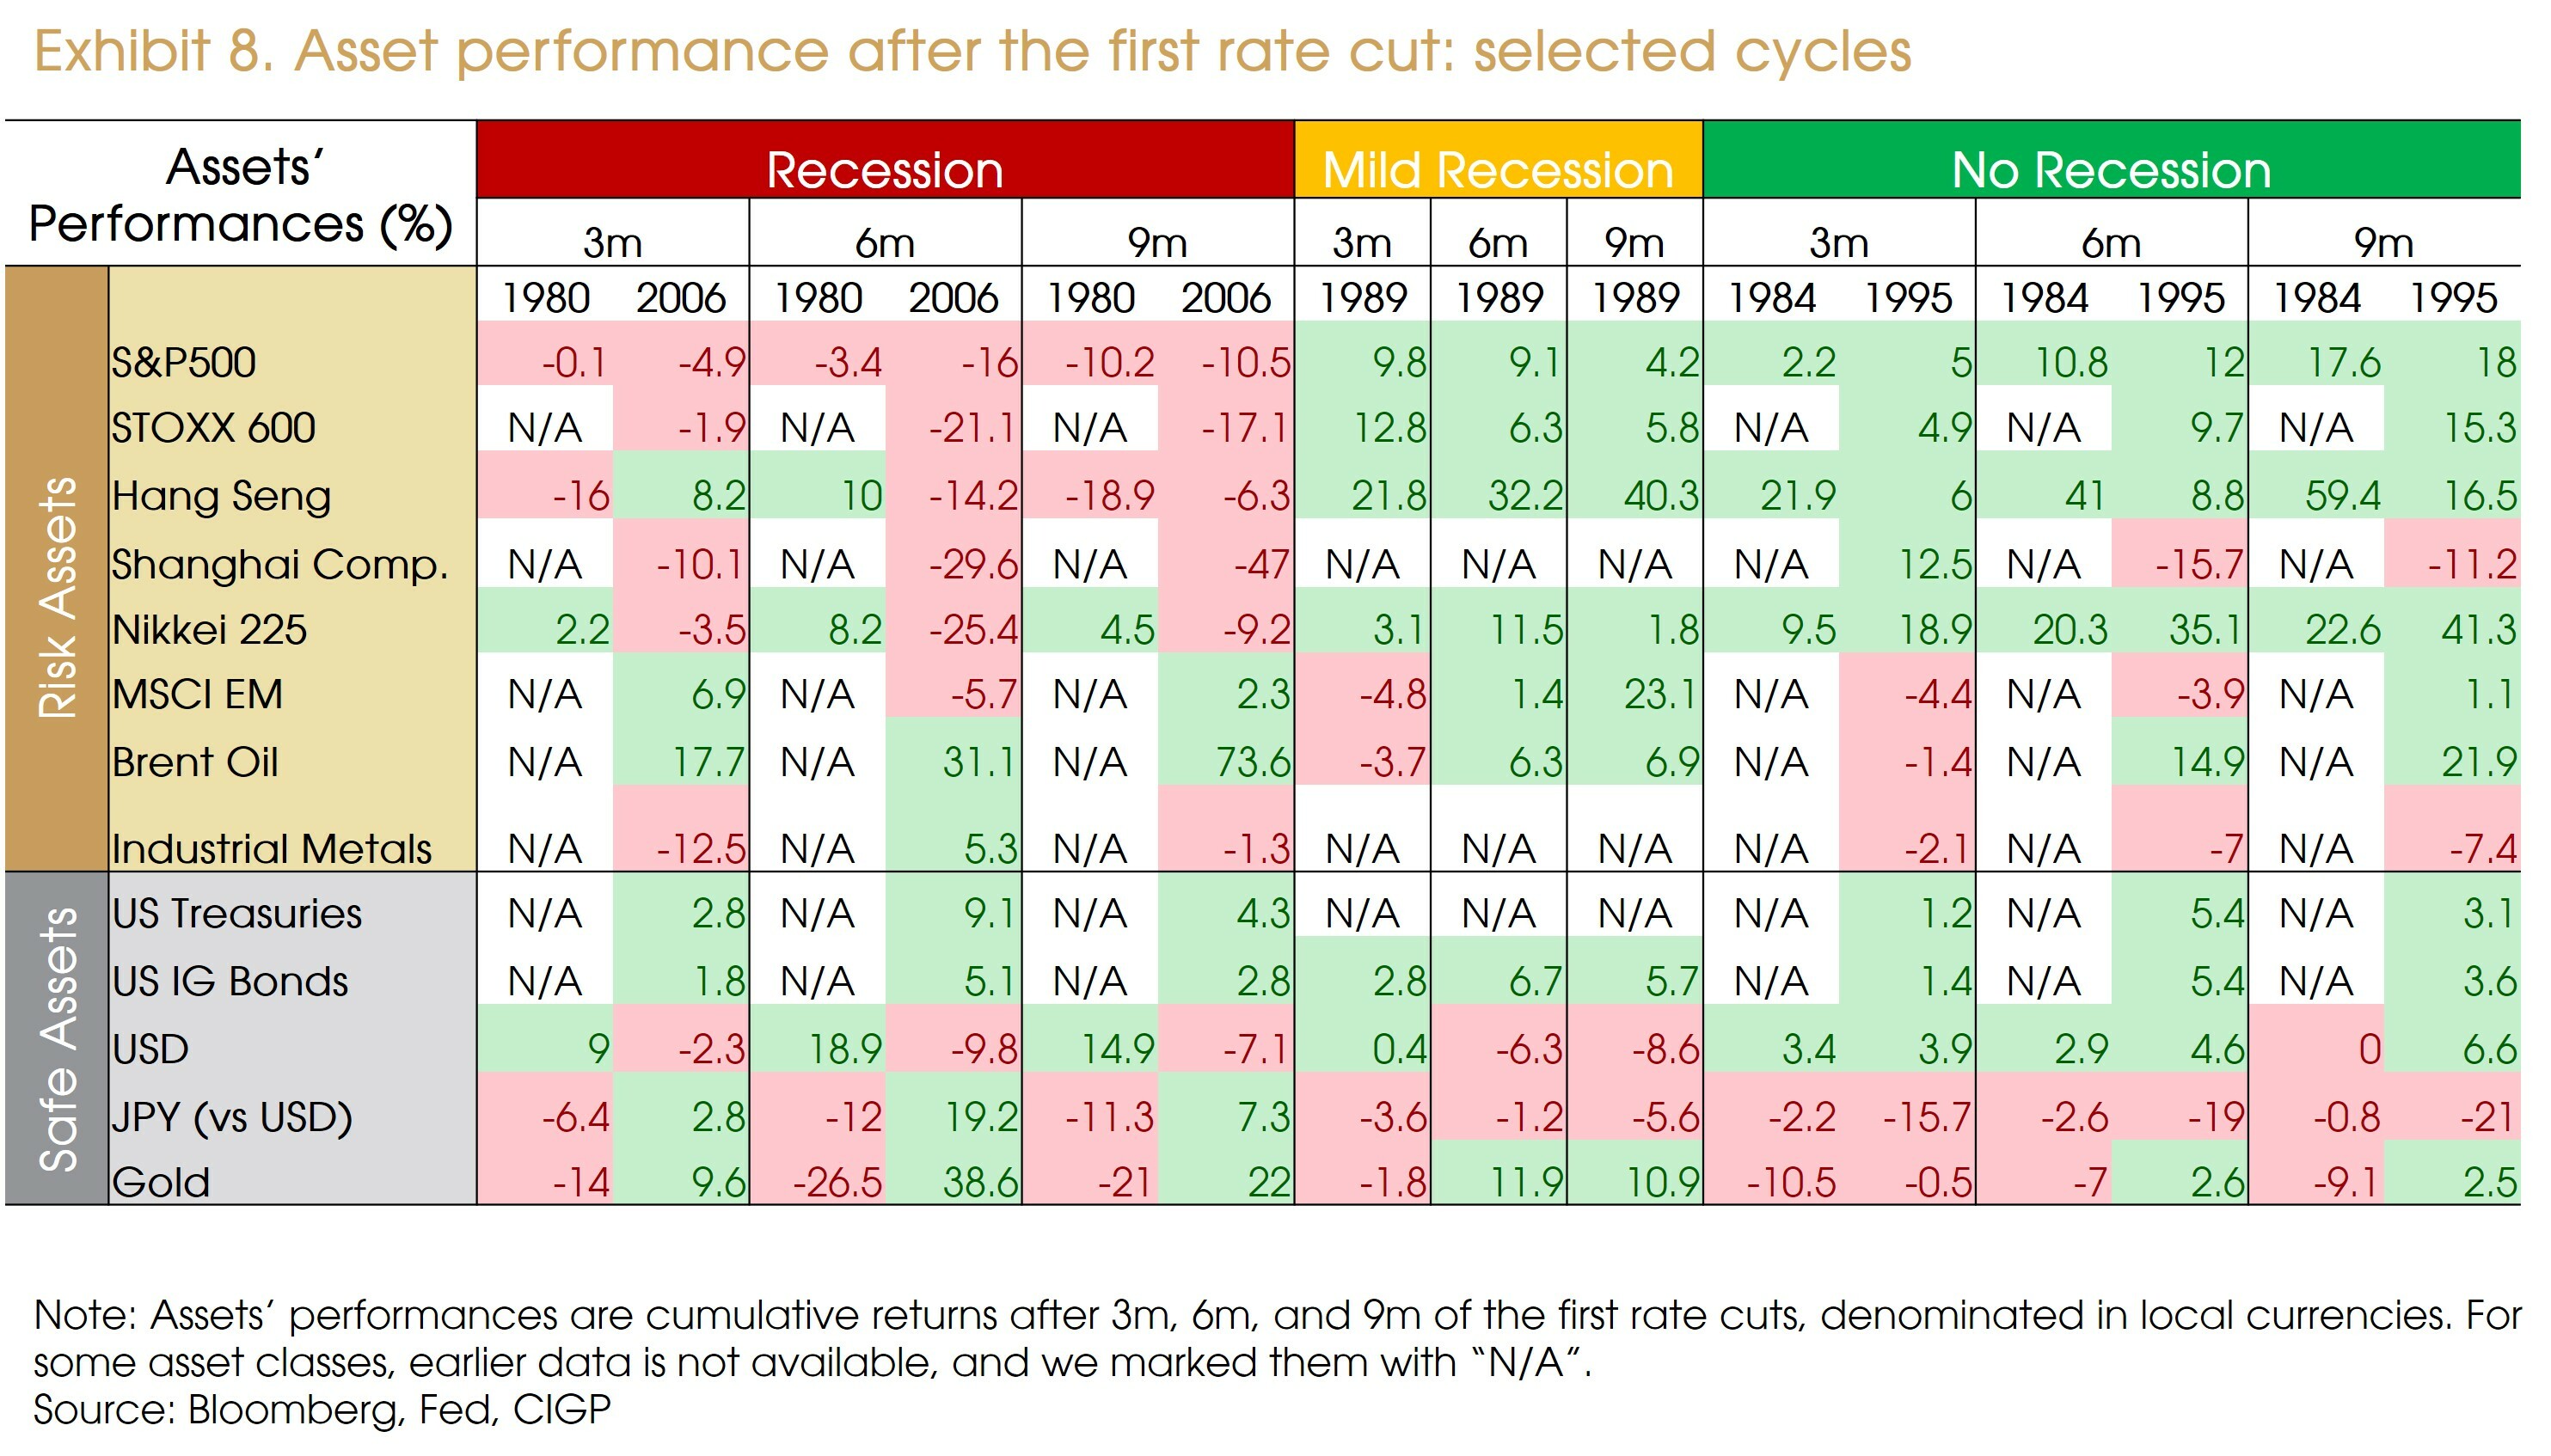
Besides, non-US equity markets hardly outperformed the US during recession periods. While some outperformed under mild or no recession cases, the pattern is inconsistent. Currently, we do not see meaningful attractiveness among non-US equity markets.
The European market still suffers from weak economic growth and higher risks stemming from geopolitical tensions and oil prices fluctuations. A potential BoJ tightening and a stronger yen will increase headwinds for Japanese corporate earnings. Emerging markets usually benefit from an easing Fed and a weaker dollar. Markets with significantly better growth outlook (e.g., India) and markets that are very cheap (e.g., China) look more compelling. However, we do not expect significant fund inflows into EM before recession risks abate further.
Among all asset classes, US IG bonds and US Treasuries consistently delivered positive returns, suggesting better risk-reward profiles in the bond market.
Therefore, upon the first rate cut this year, if there are still no clear recession signals, or only mild deteriorations, then we may see a further upside in equities and possible alpha opportunities in non-US markets. However, if notable downturns arise around the first cut, investors should position themselves defensively.
5. Continue to favor high-quality fixed-income investment in 2024
Rate cut cycles do benefit fixed-income assets.
Longer duration bonds are expected to benefit from two key tailwinds: the downward trend in inflation and below-consensus growth expectation. These factors are anticipated to provide support and favorable conditions for longer-duration bonds.
When looking at the past few decades, one can note that the median length between the last rate hike and the first cut stands at eight months. Based on historical cycles, there is a consistent pattern indicating that the end of each tightening cycle has resulted in strong returns for 10-year US Treasuries (Exhibit 9), suggesting additional upside for 10-year treasury bonds in the medium term.
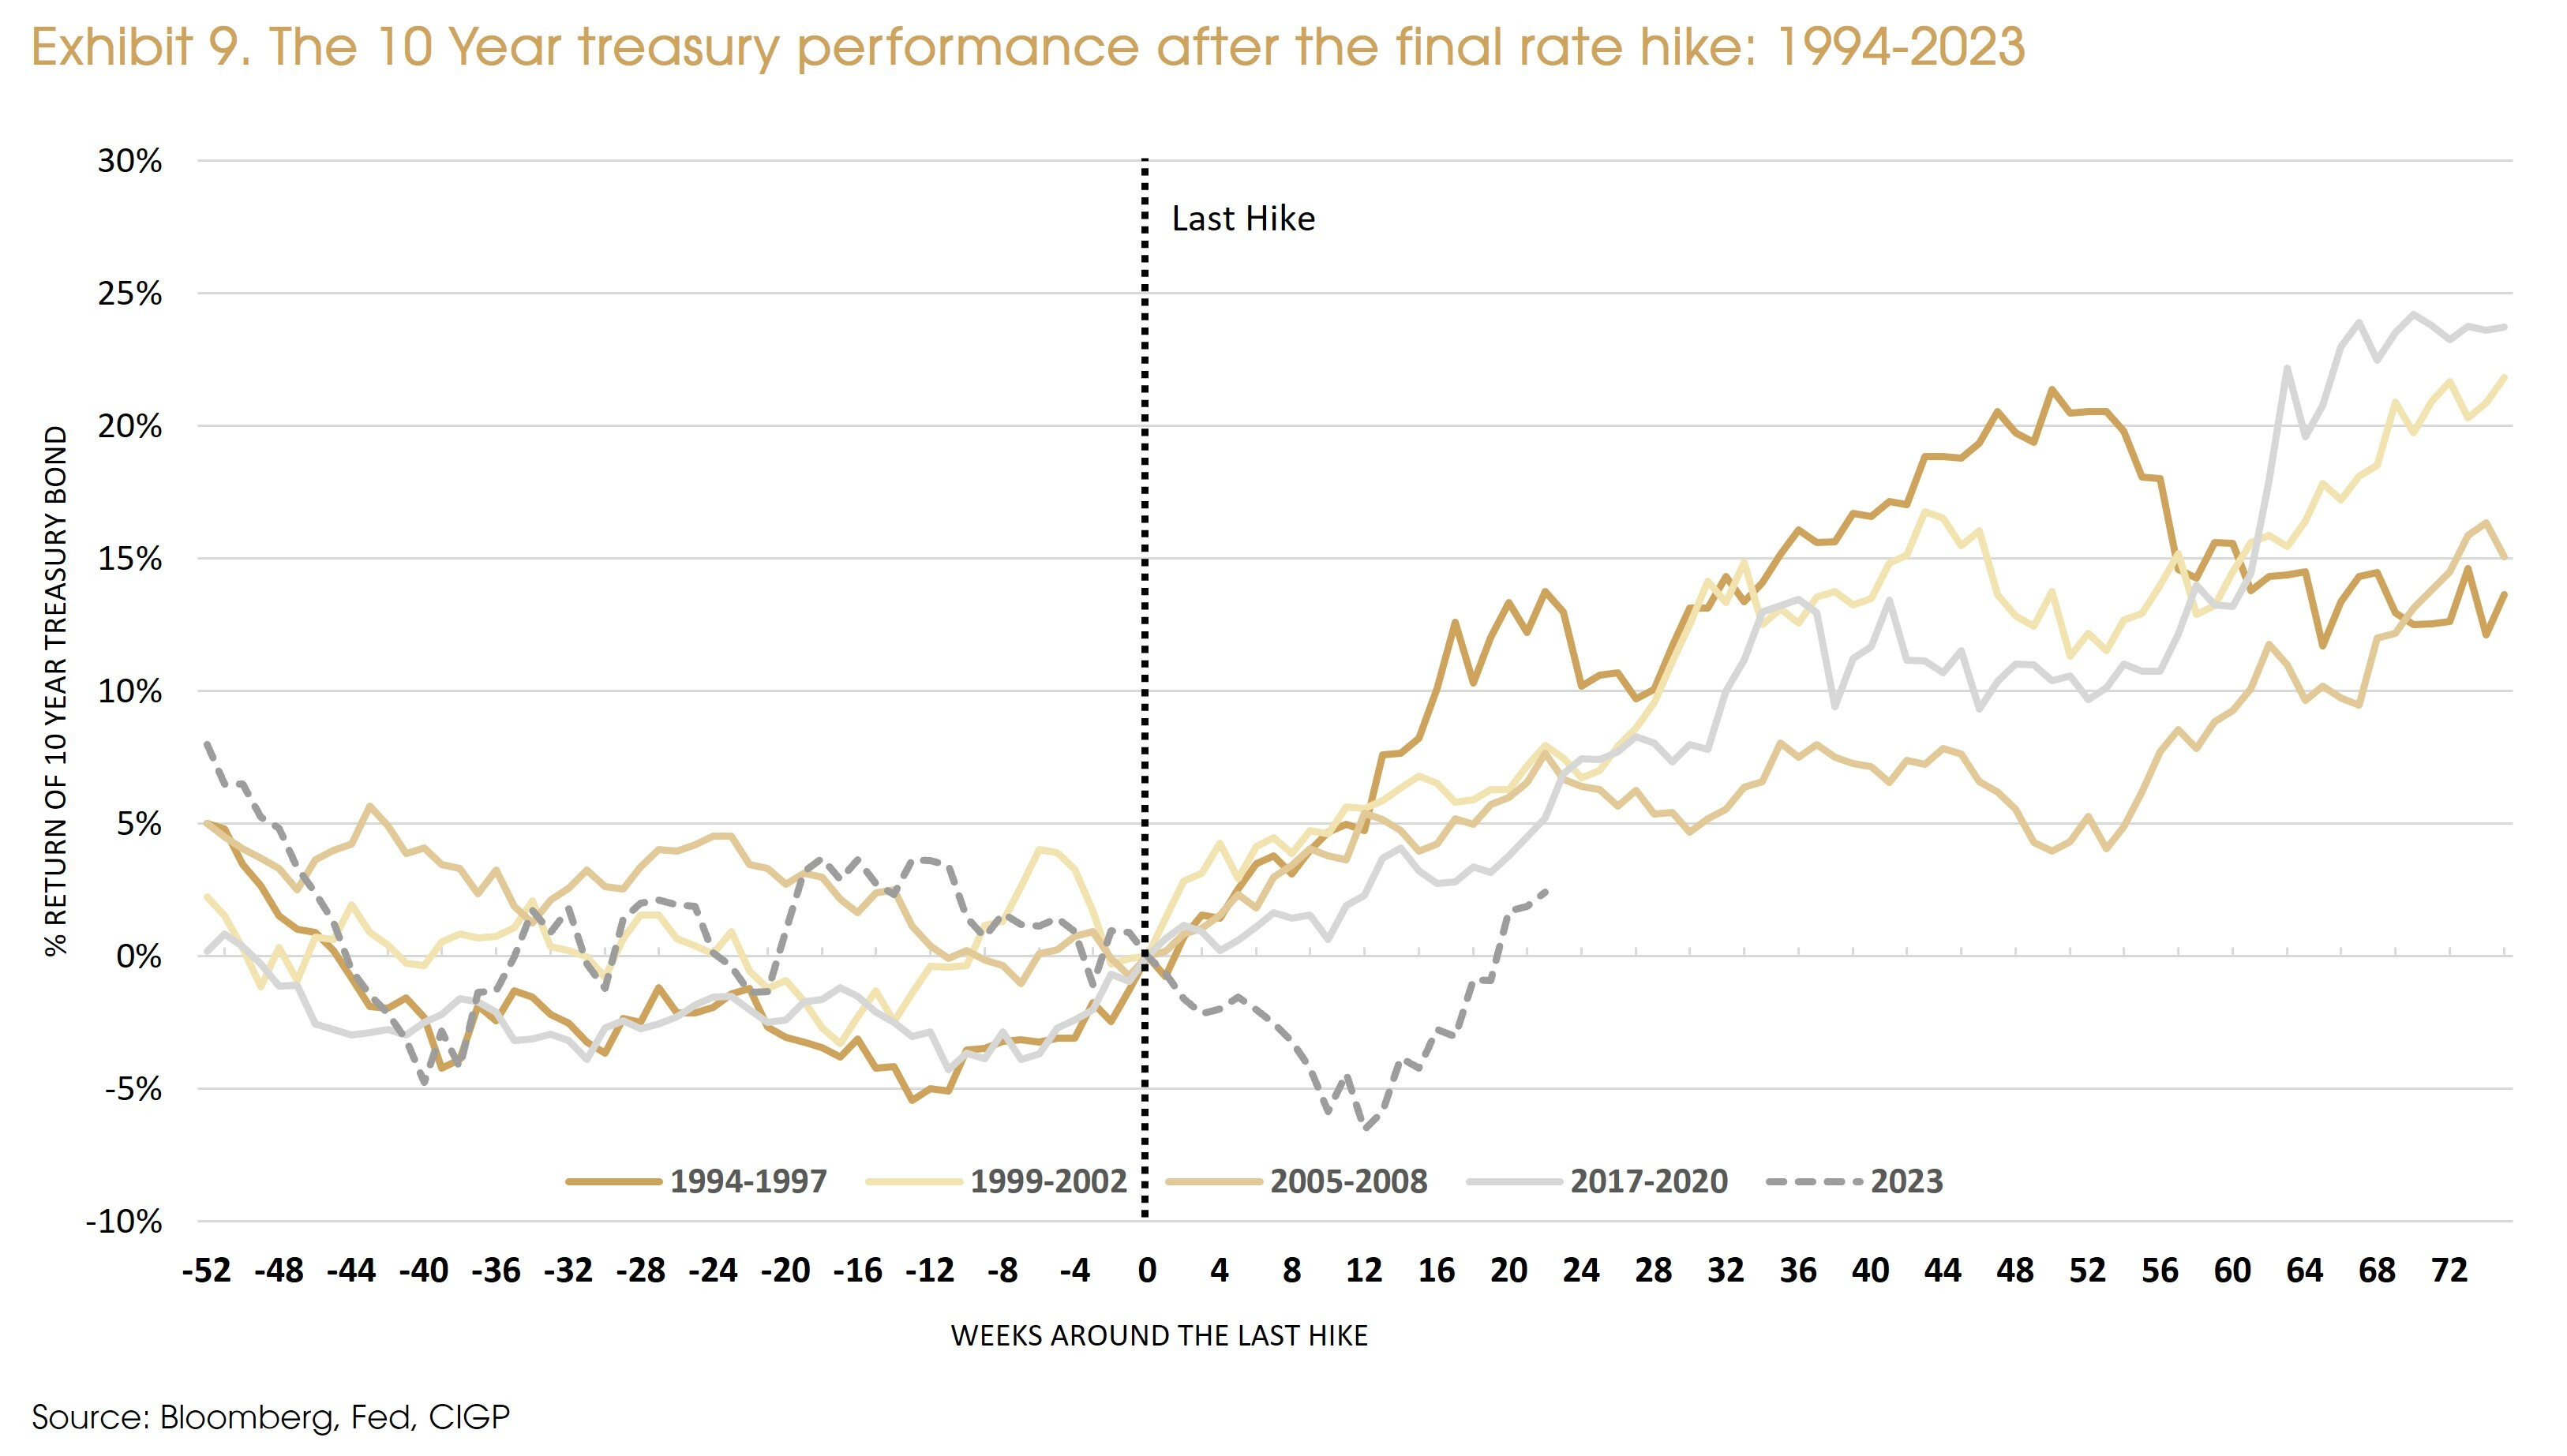
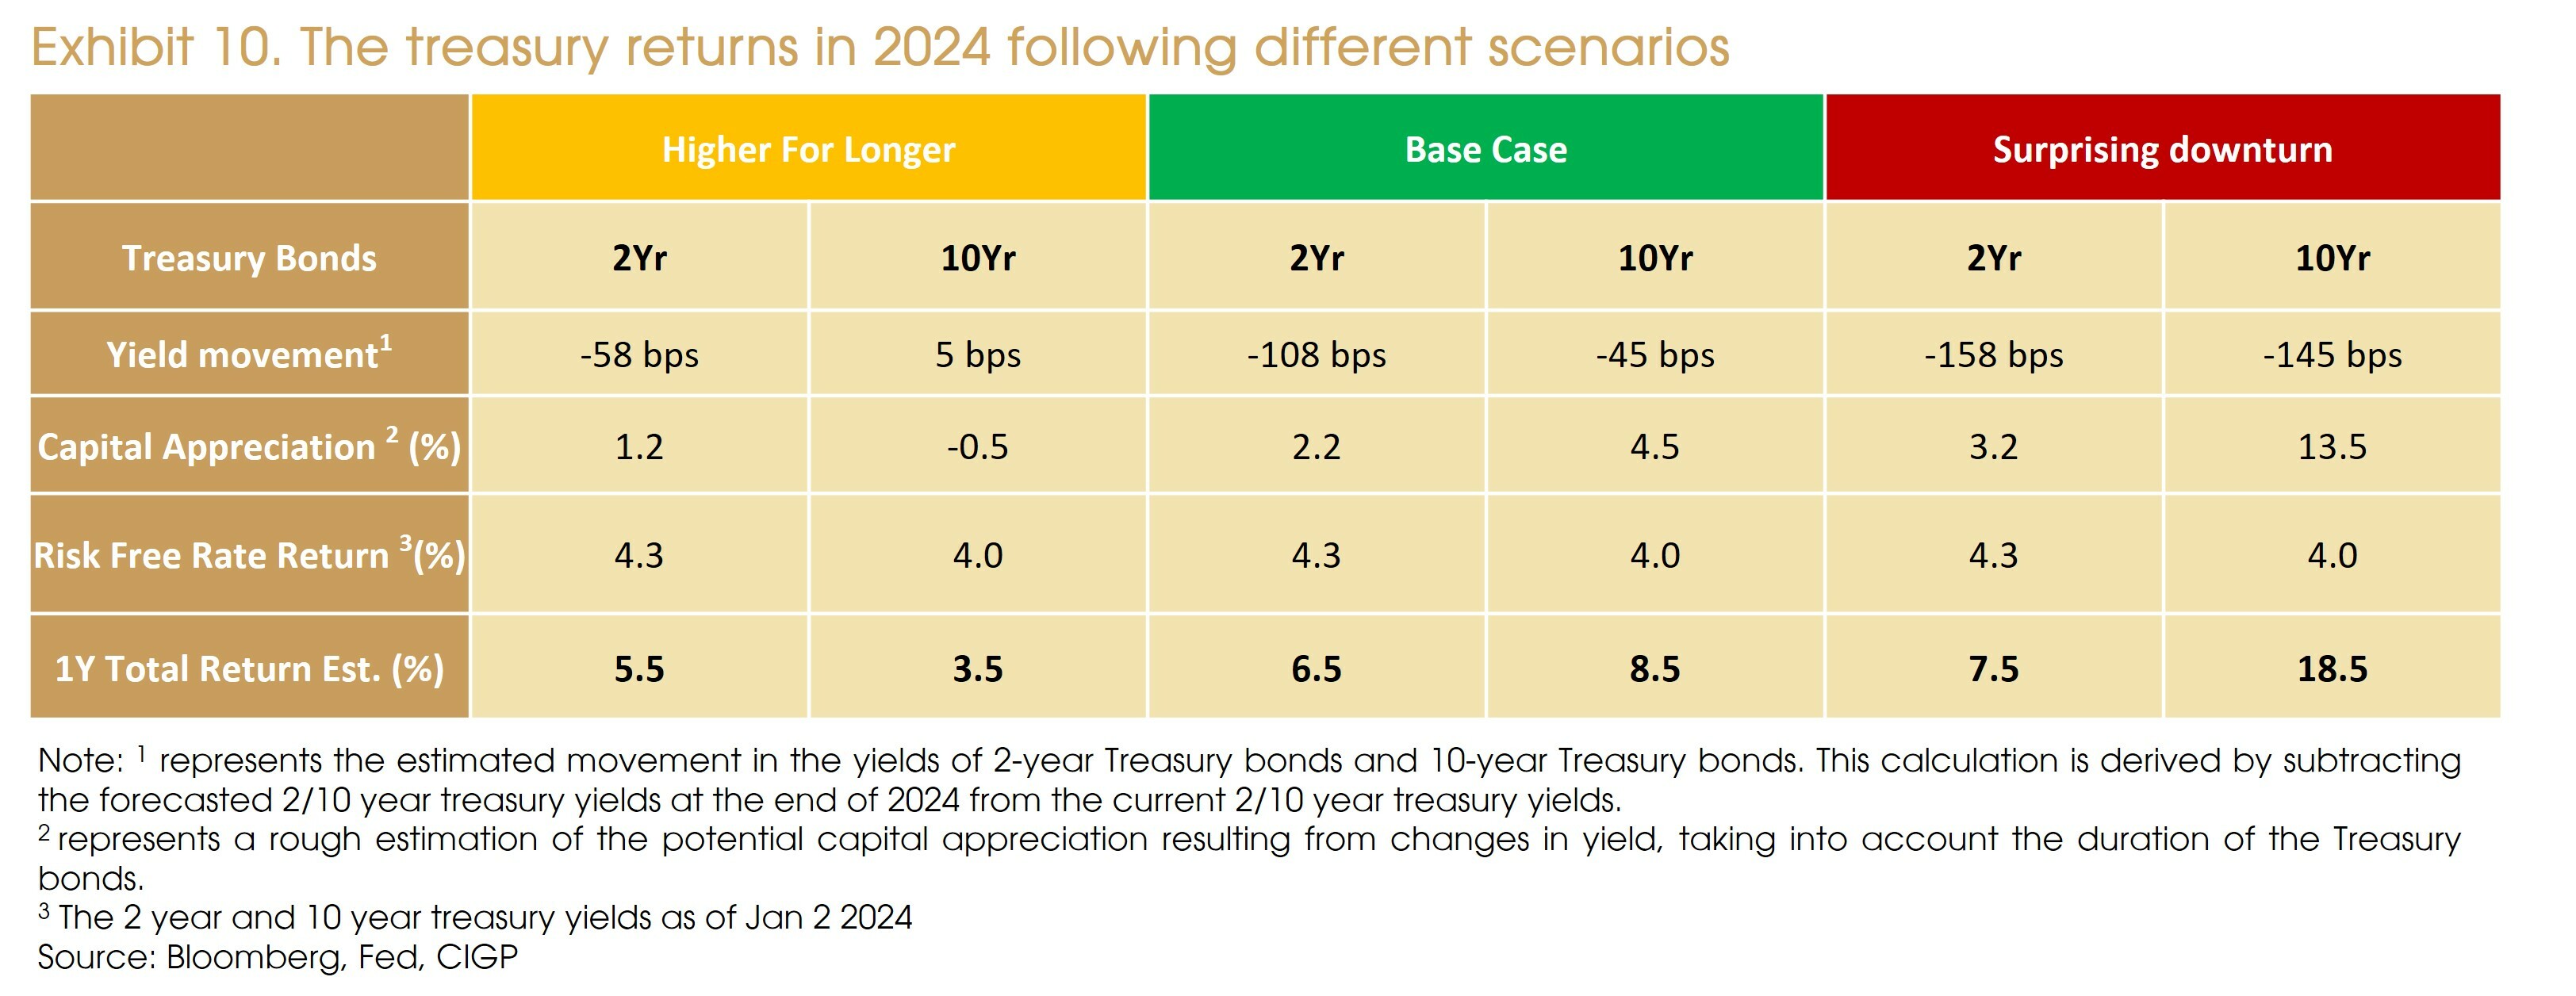
In the near term, we expect the 10-year Treasury yield to be range-bound between approximately 3.5% and 4%. However, if we have a clearer signal of a rate cut, this will drive the yield to decline further. Unless a recession occurs, holding duration may become less attractive if the 10-year Treasury yield falls below 3.5%.
Since last July, we have experienced a significant steepening of the yield curve. In a "higher-for-longer" scenario, it is anticipated that short-duration bonds will outperform. However, under our base case scenario, we expect 10-year Treasury bonds to outperform shorter-duration bonds.
Credit conditions are expected to further deteriorate, which will exert additional pressure on low-quality issuers with significant refinancing requirements (such as loan issuers).
Moody's reports that the 12-month default rate for leveraged loans (issuer weighted) rose to 5.4% in October. This falls approximately within the 80th percentile since 2000, in contrast to the 50th percentile for USD high yield issuers.
The current valuation of High Yield credit spreads remains relatively tight, making High Yield bonds' risk reward trade-off less appealing in comparison to Investment Grade (IG) bonds.
Therefore, our positive outlook on corporate bonds remains intact despite the recent correction. One should exercise caution and avoid investing in companies that carry a high liquidity risk and have multiple near-term maturities when looking at the High-Yield and Loan markets.
6. Headwinds but no bear market for commodities
As a recession is not our baseline case, we do not expect a commodity bear market in 2024. That said, disappointing global economic growth remains as a downside risk.
Metals exhibit the most solid fundamentals within the space. Supply remains tight due to low inventory and production capacity downgrades. Lower interest rates are unlikely to generate notable supply reactions, given the long lead time on mine development. However, a recovery in the manufacturing cycle and the continued “green push” from governments should both support metals demand. Positive surprises of fiscal stimulus in China should also lead a further upside in metal demand.
The supply-demand balance within the oil sector is less tight compared to the metals sector. OPEC’s spare capacity stands relatively high, while non-OPEC supply has been increasing since Q2 2022. That said, we see strong willingness from OPEC to implement the production cut as well as solid oil demand from EM economies. More importantly, oil can act as a potential hedge to rising geopolitical tensions.
Finally, we do not have strong convictions about agricultural prices. On one hand, supply disruptions have further faded, even in the face of continued geopolitical disruption, non-renewal of the Black Sea Grain Initiative, and export bans from specific countries given food security concerns. On the other hand, agriculture prices are more sensitive to supply shocks. Extreme weather or escalating geopolitical conflicts will lead to supply shortage, pushing prices to the upside. But these shocks are hard to forecast.
Disclaimer
This document is issued by Compagnie d’Investissements et de Gestion Privée Group (“CIGP”), solely for information purposes and for the recipient’s sole use and shall not be further transmitted to third parties. You have been provided with this document in your capacity as Professional Investor(s) as defined in Part 1 of Schedule 1 to the Securities and Futures Ordinance (Cap. 571). If you do not meet the Professional Investor criteria, please disregard this document.
CIGP does not assume responsibility for, nor make any representation or warranty (express or implied) with respect to the accuracy or the completeness of the information contained in or omissions from this document. None of CIGP and their affiliates or any of their directors, officers, employees, advisors, or representatives shall have any liability whatsoever (for negligence or misrepresentation or in tort or under contract or otherwise) for any loss howsoever arising from any use of information presented in this document or otherwise arising in connection with this document. This document may not be reproduced either in whole or in part, without the written permission of CIGP. Past performance is not a guarantee of future results. There can be no assurance that forecasts will be achieved. Economic or financial forecasts are inherently limited and should not be relied on as indicators of future investment performance.
This document is not a prospectus and the information contained herein should not be construed as an offer or an invitation to enter into any type of financial transaction, nor an act of distribution, a solicitation or an offer to sell or buy any investment product in any jurisdiction in which such distribution, offer or solicitation may not be lawfully made. Certain services and products are subject to legal restrictions and cannot be offered worldwide on an unrestricted basis and/or may not be eligible for sale to all investors. Unless cited to a third-party source, the information in this document is based on observations of CIGP. The information provided is based on numerous assumptions. Different assumptions could result in materially different results. Before acting on any information you should consider the appropriateness of the information having regard to your particular investment objectives, financial situation or needs, any relevant offer document and in particular, you should seek independent financial advice. All securities and financial product or instrument transactions involve risks, which include (among others) the risk of adverse or unanticipated market, financial or political developments and, in international transactions, currency risk. The contents of this report have not been and will not be approved by any securities or investment authority in Hong Kong or elsewhere.
CIGP acts as an agent when recommending or distributing investment products. The product issuer is not an affiliate of CIGP. CIGP is an independent intermediary, because: (i) we do not receive fees, commissions, or any other monetary benefits, provided by any party in relation to our distribution of any investment product to you; and (ii) we do not have any close links or other legal or economic relationships with product issuers, or receive any non-monetary benefits from any party, which are likely to impair our independence to favour any particular investment product, any class of investment products or any product issuer. Neither us nor our group related companies shall benefit from product origination or distribution from the issuers or providers, whether in monetary or non-monetary terms. We do not provide any discount of fees and charges.
Sources: Bloomberg, Brookings Hutchins Centre, Cleveland Fed, CIGP, Eurostat, Federal Reserve, IMF, Market Forecast, New York Fed.


